As fire-weather risk expands beyond California, utilities are turning to sub-kilometer, asset-level forecasts to support public safety power shutoff decisions they can defend in front of regulators.
When the National Weather Service (NWS) issued routine convective outlooks on the morning of May 27, 2025, public guidance for the Houston metro called for widespread 30 to 40 mph wind gusts, with isolated pockets reaching 45 to 60 mph. CenterPoint Energy’s meteorology team was looking at a different picture. A sub-kilometer model from Climavision was flagging slow-moving thunderstorms with gusts above 50 mph and identifying a specific corridor—Greenspoint, The Woodlands, Humble, Kingwood, and Galveston—where the worst wind would land. The forecast was specific enough, and confident enough, to act on. CenterPoint pre-deployed 1,300 crews at midnight rather than leaving them on standby. Observed gusts came in at 60 to 70 mph in that exact corridor. Peak outages were held to roughly 167,000 customers. By the end of the day, the utility was 99% restored.
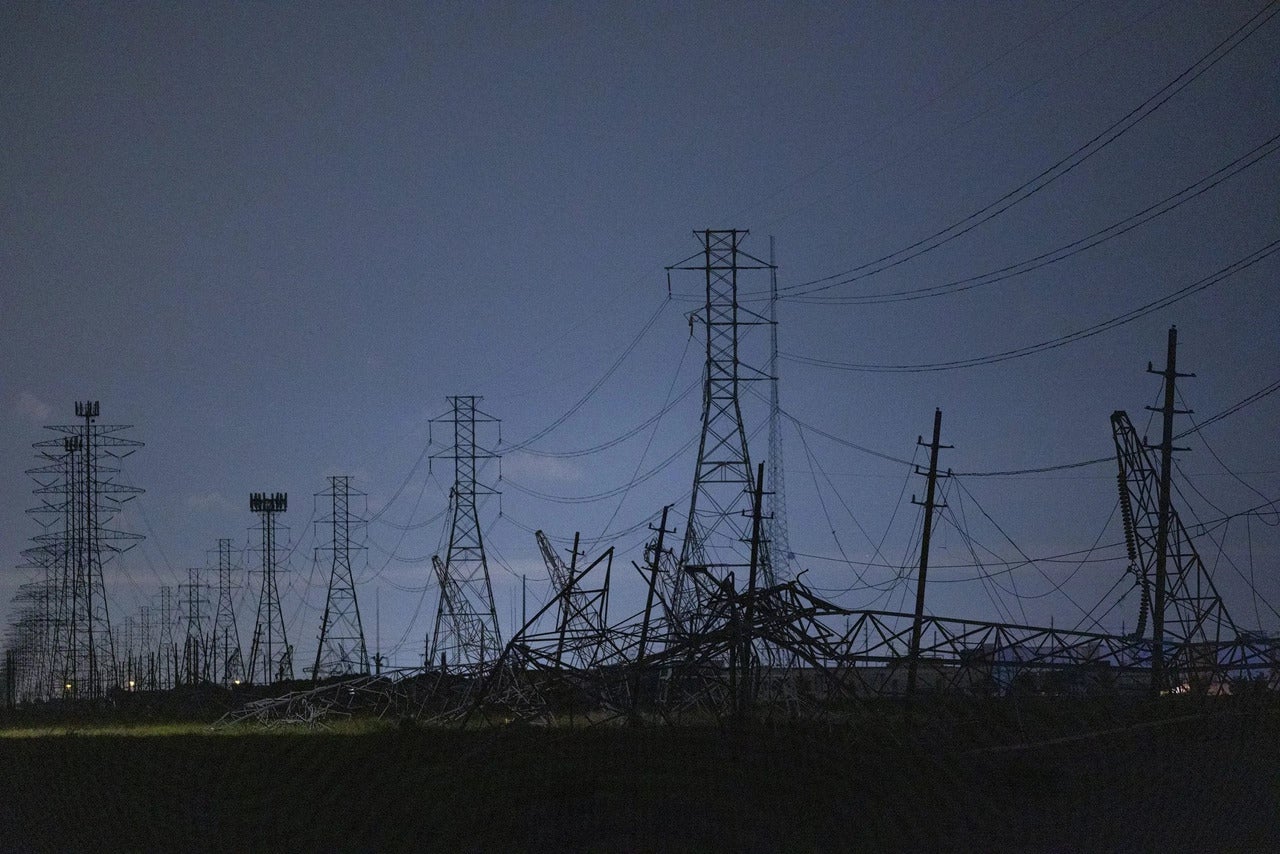
That kind of decision—pulled forward into the hours before a storm hits, anchored on a forecast specific enough to defend in front of a regulator afterward—is what utilities increasingly want from the advanced-forecasting layer they sit on top of public weather products. And it isn’t only a Western U.S. story anymore. Drought-stressed fuels in the Carolinas and Tennessee, frontal-passage drying across the New Jersey Pinelands and Long Island, and damaging convective downbursts across the central U.S. (Figure 1) are pulling fire-weather risk into territory where most utilities historically did not plan for it.
Three providers POWER spoke with—Climavision, Meteomatics, and Technosylva—describe distinct technical approaches but converge on the same practical observation: the resolution, refresh rate, and forecast horizon utilities now require for wildfire and severe-weather decisions are well past what public products deliver, and the gap matters most in the two- to three-day window when public safety power shutoffs (PSPSs) and crew-mobilization decisions actually get made.
The Resolution and Refresh-Rate Story
The clearest way to understand the gap between public forecasts and what advanced providers are now selling is in two numbers: spatial resolution and update frequency. The National Oceanic and Atmospheric Administration’s (NOAA’s) High-Resolution Rapid Refresh (HRRR) model, the workhorse short-range product most utility meteorology desks consult, runs at roughly 3-kilometer (km) grid spacing with hourly updates but only out to 18 to 48 hours.

In This Issue
Full issueClimavision runs its HI-RES physics-based model—a derivative re-engineered from the HRRR lineage—at 2 km across the continental U.S. with an optional 670-meter inset over a customer’s service territory, refreshing every six hours and extending out to a full seven days. Climavision Founder and CEO Chris Goode summarized the difference as “customized physics, proprietary observations, and a higher-resolution inset that public or private models simply do not produce.” For point-specific forecasts at substations and key circuit segments, the company’s Point Forecast Solution updates at 15-minute intervals out to 15 days, blending output from more than 100 underlying models with machine-learning bias correction trained on local observations.
Meteomatics takes a different but parallel approach. Its US1k model runs at 1-km resolution with hourly updates, ingesting weather data from more than 110 sources, including aircraft, ground stations, drones, radars, and satellites. Among those sources is the company’s proprietary Meteodrones—weather drones capable of flying up to 6 km above mean sea level, sampling layers of the lower atmosphere where conventional radiosondes only fly twice a day. Chris Hyde, a senior account executive and meteorologist at Meteomatics, framed the resolution argument bluntly: standard global model resolution is 20 km, leading U.S. solutions reach 9 km, and “Meteomatics’ US1k model has a resolution of 1 km and updates every hour.”
Technosylva focuses specifically on fire behavior modeling rather than general weather forecasting. Indran “Indy” Ratnathicam, chief growth officer at Technosylva, told POWER the company operates its own continental-scale Weather Research and Forecasting (WRF) implementation at 2-km resolution, optimized for predicting fire and extreme weather conditions. That weather model feeds into hourly asset-level fire-risk and danger forecasts that look five days into the future. Ratnathicam said the company runs roughly 9 billion simulations a day across customer territories, drawing on more than 20 years of training data.
The Two-to-Three-Day Decision Window
Resolution and update frequency matter operationally because of a specific window. PSPSs are typically called two to three days in advance. “Once dangerous fire weather shows up in the short-range forecast, the window to do customer notifications, mutual aid staging, and regulatory paperwork well has already closed,” Goode said.
Public HRRR’s 18- to 48-hour ceiling sits inside that window, not ahead of it. That is the structural gap advanced providers are trying to close. Meteomatics shared one quantitative anchor from its work with NorthWestern Energy: between Oct. 31 and Nov. 3, 2025, the platform captured 16 wildfire-risk alerts across 16 sub-regions of NorthWestern’s 626 high-risk weather zones, with an average lead time of 46 hours. That converts a reactive de-energization into a planned one—and converts a defensive scramble into something a utility can document and explain.
The other half of the decision-window story is the value of correctly placing risk that doesn’t materialize where the public guidance puts it. In Climavision’s Winter Storm Fern case from late January 2026, the company’s HI-RES model issued three days ahead placed the heaviest icing well north of CenterPoint’s service area. That precision, Goode said, allowed the utility to keep its crews staged for localized outages rather than mobilizing toward a region that ultimately wasn’t badly affected—“a quieter outcome than May 27, but a meaningful one for cost discipline and crew readiness.”
Wildfire Risk Beyond the West
A strong theme across all three providers is geographic expansion. Both Climavision and Meteomatics emphasized that demand for wildfire-aware forecasting has moved well past California and the Northern Rockies. Goode named drought-stressed fuels in the Carolinas and Tennessee, frontal-passage drying in the New Jersey Pinelands and on Long Island, and convective downbursts across the central U.S. that drop lines into dry vegetation. Hyde made the same point about expanding wildfire-mitigation focus into “states such as New Jersey, Georgia, and Florida.”
The 2024 derecho events are the most cited examples of how that expansion plays out for utilities operating outside the traditional fire-weather geography. Climavision said its HI-RES model flagged the severe-wind threat from the May 16, 2024, Houston derecho, which produced 100-mph gusts, in consistent runs eight hours ahead of public models, and resolved the 80-plus mph wind threat from the July 15, 2024, northern Illinois derecho 12 hours ahead of the public HRRR—events that knocked transmission out for days and dropped distribution lines into drought-stressed fuels in regions that would not have been on a five-year-old wildfire-risk map.
Custom Thresholds and Utility-Defined Zones
A second technical theme worth pulling out is the move away from vendor-defined alert defaults toward zone-specific, utility-owned thresholds. The CenterPoint implementation runs distinct alert streams for temperature, sustained and gust wind, precipitation, severe storms, and icing—each tied to the 13 operational regions CenterPoint uses for situational awareness. NorthWestern Energy’s 626 high-risk weather zones each carry their own thresholds. “Each weather monitoring zone’s thresholds are customized to that area,” Hyde said, “so there are no general or overarching thresholds.”
Compound conditions are now standard. Goode described fire-weather alerts that pair a relative-humidity floor with a wind threshold, often gated by an antecedent dry-spell or temperature condition; blow-down alerts on saturated ground that pair gusts with soil moisture; severe-storm alerts that pair a severe-storm index with precipitation in the same forecast hour; and winter alerts that combine temperature, precipitation type, and accumulation across a defined window.
Both Climavision and Meteomatics emphasized that utility-owned observation networks now feed back into the model. Climavision assimilates more than 150 surface stations from CenterPoint into its 670-meter Houston inset; Meteomatics described ingesting customer station data for local calibration as a baseline feature. The distinction matters because, as Goode put it, the goal is “ground truth they already trust” turned into “a sharper, more accurate forward-looking forecast”—rather than asking the dispatch desk to reconcile a vendor product with sensor data the utility already has on the ground.
The Urban Conflagration Problem
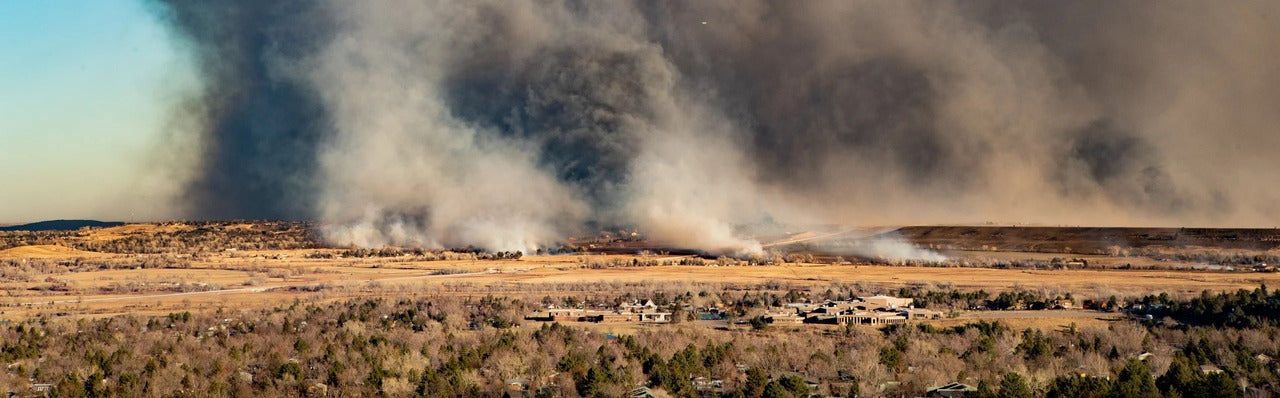
A separate technical gap, and one that doesn’t show up in standard wildfire models at all, is what fire does once it reaches a populated area. Most wildfire-spread modeling relies on the federal LandFire dataset, which classifies urban areas as “non-burnable.” Standard models using LandFire as input show little or no fire spread through urban environments—exactly the opposite of what occurred in the 2023 Lahaina Fire on Maui, the January 2025 Palisades Fire in Los Angeles, and the 2021 Marshall Fire in Boulder County, Colorado, which destroyed roughly 1,000 homes in Louisville and Superior (Figure 2).
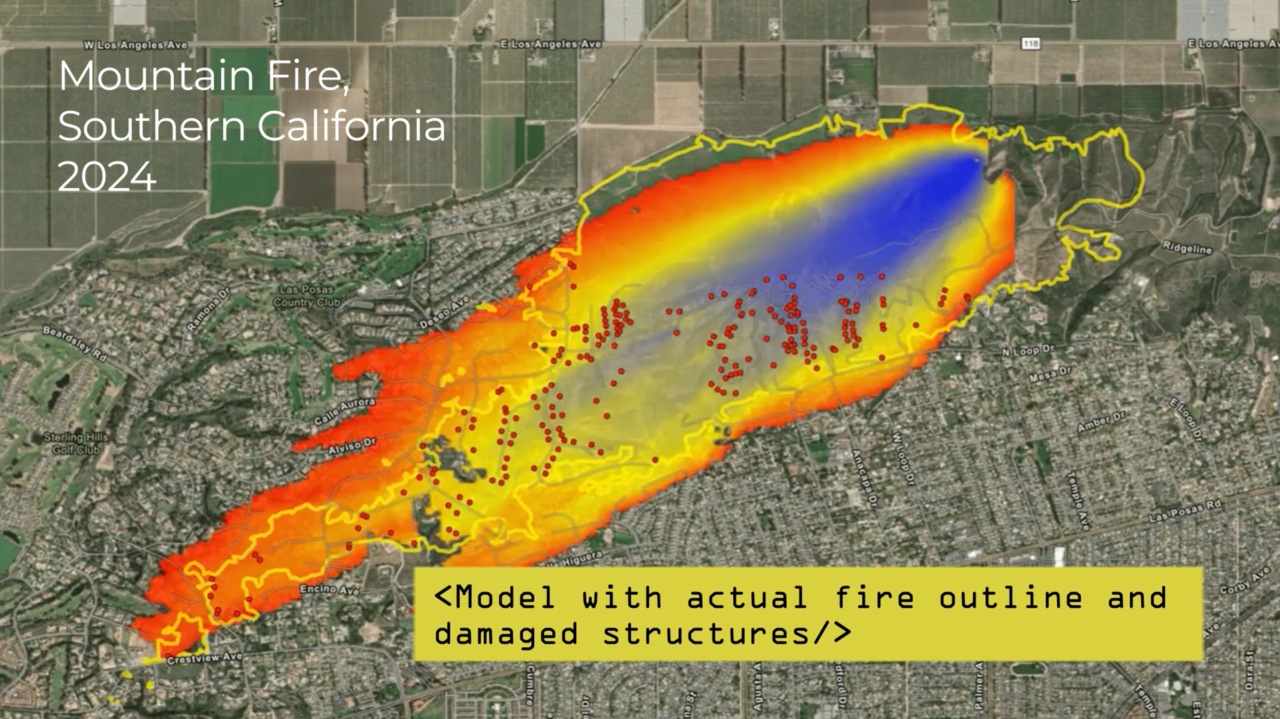
Ratnathicam said Technosylva has built a comprehensive new fuel-classification dataset specifically for urban environments, including structures, and redesigned its rate-of-spread calculations for urban areas based on hundreds of historical urban fires. The company has also added what it calls a Dynamic Building Loss Factor, which captures structure-to-structure spread, predicts structural losses, and accounts for how fire navigates large gaps of less-burnable areas like streets and how individual homes contribute to and accelerate spread once ignited.
The model combines physical and empirical methods, with a probabilistic layer derived from running scenarios across two decades of training data. Sources include the National Interagency Fire Center, the U.S. Forest Service, satellite thermal observations, infrared fire-progression perimeters, low-Earth-orbit and space-based light detection and ranging (LIDAR), weather stations, and a number of private datasets.
The urban conflagration capability is being built into Technosylva’s existing utility-facing products this year (Figure 3)—both the planning-tier products that support grid hardening, vegetation management, and capital prioritization; and the operational-tier products that deliver hourly asset-level fire risk five days out and integrate into PSPS, enhanced powerline safety settings (EPSS), and fire-agency coordination workflows. “It isn’t a separate offering bolted onto our existing models—it’s built into them,” Ratnathicam said.
Physics, AI, and the Documentation Tail
A subtler theme—but one with real implications for utility executives carrying regulatory and legal exposure—is the divide between physics-based and artificial intelligence (AI)-native forecasting models. AI weather models from major tech companies have advanced rapidly over the past two years, often outperforming traditional numerical weather prediction on benchmark tests. But for utilities, raw skill is not the only criterion.
“A growing share of weather products in the market is AI-native—useful and improving quickly, but opaque by design,” Goode said. “When an operator has to explain to a regulator or a court why a particular de-energization, restoration timing, or staging decision was made, ‘the AI model said so’ is a difficult position to defend.” Climavision’s HI-RES is built on physics-based forecasting, with machine learning layered on top to sharpen specific components rather than replace them; the company describes those layers as auditable.
Hyde made a similar point from a different angle: “Although there is a lot of hype around AI in weather forecasting, those models still need time to prove its accuracy.” High-resolution physics-based modeling, he argued, is currently where the most operationally beneficial progress is happening for the 48-hour wildfire-mitigation horizon.
Technosylva’s positioning is also explicitly hybrid. Ratnathicam described the company’s approach as “a unique combination of physical and empirical modeling, which strikes a critical balance between how the real world works, and reconciles what we are actually seeing.”
Underneath the technical preference is a regulatory reality that all three providers gestured at. State public utility commissions, the Federal Energy Regulatory Commission (FERC), and class-action plaintiffs are increasingly asking utilities to document what they knew, when they knew it, and why they acted. That makes the forecast itself part of the utility’s defensible record, alongside line patrols and inspection logs. As Goode put it, “weather intelligence is no longer only an operational input. It is part of the defensible record submitted after the event.” Meteomatics described its platform in similar terms—a system in which utilities can “document exactly when thresholds were met, what alerts were triggered, and how those conditions justified the action.”
Forecasting Gaps That Remain
Asked where advanced forecasting still falls short, the three providers gave different answers, but the answers triangulate. Climavision pointed to confidence rather than raw accuracy: utilities are awash in weather data, Goode said, but “short on knowing which conflicting model outputs to trust for their specific territory in the next 2–3 days.” Sub-grid, terrain-driven wind behavior—ridges, lee slopes, coastal escarpments—remains under-resolved at public-grid scale, and fuel-state and vegetation dryness are not native variables in any standard weather model, forcing operators to stitch them in from separate feeds.
Hyde identified timing as the key gap—refreshing forecasts more frequently while preserving accuracy—and said Meteomatics is working on additional local wind fields, terrain effects, and thunderstorm-structure capabilities in the US1k model.
Ratnathicam said Technosylva’s current research and development is focused on extending forecasts beyond the present five-day horizon without sacrificing accuracy. “Last August, we brought online the world’s largest supercomputer dedicated to fire science—a substantial investment in high-performance computing that gave us full coverage of the U.S.,” he said.
Forecasting as the Input to Grid Modernization
Whichever vendor a utility chooses—and many will run more than one—the strategic position of the advanced-forecasting layer in the broader grid-modernization stack is becoming clearer. Advanced forecasting, as Goode summarized, “sits at the input layer of grid modernization.” Digital twins, dynamic line rating, vegetation-management programs, distributed-energy-resource dispatch, and predictive outage models all consume weather as a primary input. The accuracy and resolution of that input set the ceiling for every downstream decision.
The stakes underneath the engineering are not abstract. “Wildfires are becoming more frequent and more destructive,” Ratnathicam said. “These events impact real people—their homes, their livelihoods, and their communities—they are not just data points on a screen.”
For 2026, the practical question utilities are working through is not whether to invest in advanced forecasting but how to integrate it deeply enough that it shows up in operational decisions, regulatory filings, and capital plans. The May 2025 Houston event suggests what that looks like when it works. The 2024 derechos suggest what it looks like when it doesn’t.
—Aaron Larson is POWER’s executive editor.