
Transmission corridors can be difficult to inspect, sometimes requiring helicopters and boots on the ground. A Daytona Beach, Florida, company is using drones to improve the process—at roughly a quarter of the cost.
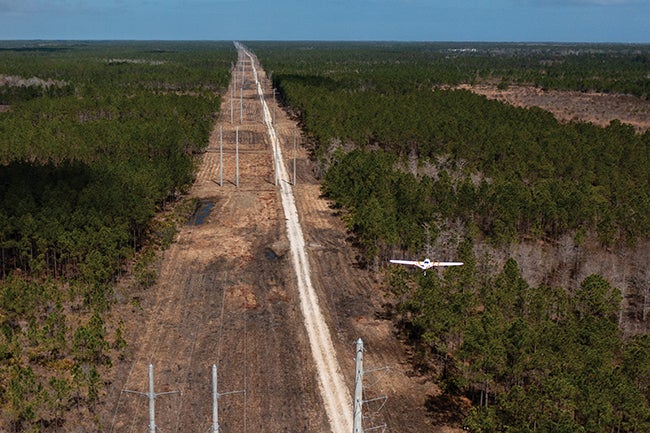
On the morning of Feb. 3, 2026, a small team from Censys Technologies stood at their Daytona Beach headquarters and watched a fixed-wing drone the size of a large model airplane climb into the Florida sky. Over the next two and a half hours, that aircraft—a Sentaero 6 equipped with light detection and ranging (LiDAR) technology and a 45-megapixel camera—would travel 83.4 miles across some of the most heavily regulated airspace in the state, inspecting 77.7 miles of high-voltage transmission corridor (Figure 1) between Daytona Beach (DAB) and Mims.
 |
|
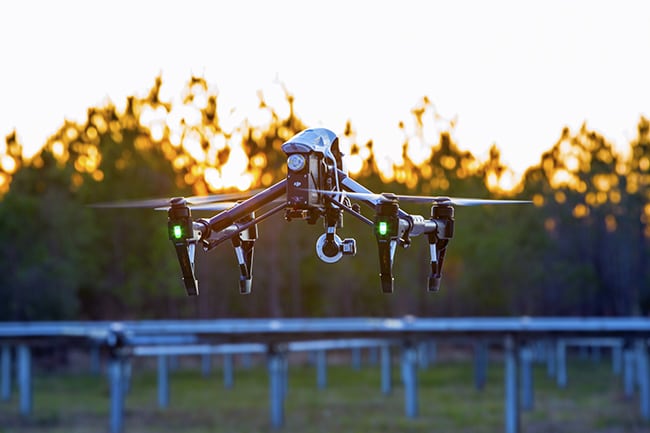
1. A Sentaero 6 flies along a utility transmission corridor in Florida. The aircraft inspected 77.7 miles of powerline infrastructure in under 2.5 flight hours. Courtesy: Censys Technologies |
No helicopter. No multi-day ground survey. No army of contractors. Just one drone, a laptop running a ground control station, and a crew that had spent 21 hours planning every second of the flight.
The result was 140 gigabytes of raw intelligence in the form of 3D LiDAR point clouds and high-resolution imagery, processed and turned into actionable vegetation-clearance analysis in less than five hours. The entire operation, from setup to breakdown, took just over three hours on site. And perhaps most remarkably, every bit of it was legal under existing Federal Aviation Administration (FAA) rules.
The Problem No One Talks About
Electric utilities in the U.S. manage hundreds of thousands of miles of transmission corridors. Keeping vegetation clear of those lines isn’t optional; it’s a matter of grid reliability, regulatory compliance, and, in fire-prone regions, public safety. A single tree limb contacting a high-voltage conductor can cascade into widespread outages or, in the worst case, spark a wildfire.

In This Issue
Full issueThe traditional approach to monitoring these corridors hasn’t changed much in decades. Helicopter patrols sweep the lines at speed, visual observers flag what they can see, and ground crews follow up where access permits. Multirotor drones have entered the picture in recent years, but their limited range means they can only cover small sections at a time—a few spans here, a substation there. For a utility managing thousands of miles of infrastructure, that piecemeal approach barely scratches the surface.
The DAB-to-Mims mission was designed to prove that a fundamentally different model is possible: end-to-end corridor inspection, where a single flight captures a complete, measurable dataset across dozens of miles in one operation.
What’s a BVLOS Mission, and Why Does It Matter?
BVLOS stands for beyond visual line of sight—meaning the aircraft flies far enough from its operators that they can no longer see it directly. Most commercial drone operations in the U.S. require the pilot to maintain visual contact with the aircraft at all times. BVLOS waivers, granted by the FAA under Part 107 rules, allow operators to fly well beyond that constraint, but they come with significant planning and coordination requirements.
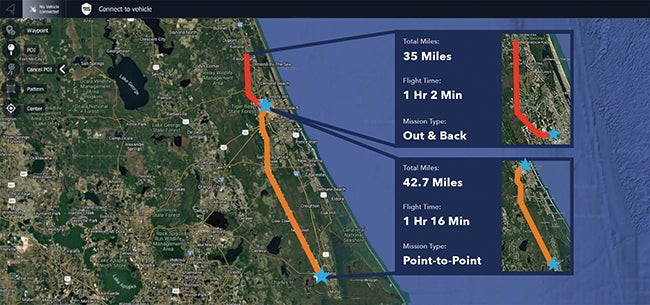
The DAB-to-Mims corridor (Figure 2) didn’t make that easy. The flight path cut through Class C airspace around Daytona Beach International Airport (KDAB), Class D airspace near Ormond Beach, and Restricted Area A-294. Before takeoff, the Censys team coordinated directly with the KDAB control tower for a go/no-go determination. Altitude restrictions limited the aircraft to 300 feet above ground level (AGL) along most of the route and just 200 feet near airport approach and departure zones. Twenty-two roadway crossings were classified and timed—each one a brief, one-to-three-second transitory exposure as the drone passed overhead.
 |
|
2. The two-leg mission profile: Leg 1 covered 35 miles as an out-and-back from Daytona Beach to Ormond Beach; Leg 2 flew 42.7 miles point-to-point from Ormond Beach to Mims. Courtesy: Censys Technologies |
Many people believe long-range drone operations like this require new regulations that haven’t been written yet. “The most common misconception is that BVLOS operations aren’t possible today under Part 107,” said Michelle Anastasio, Censys’s Digital Media and Content Specialist. “What we’ve demonstrated is that scalable, repeatable BVLOS operations can be conducted today within the existing framework when systems are designed from the ground up for safety, compliance, and operational consistency.”
The FAA coordination itself was smoother than many in the industry might expect. Matthew Davis, who served as Remote Pilot in Command and is the company’s Director of Customer Success, said the airspace authorization took about a month, which he considered “fast.” The FAA authorized them to fly at 200 feet AGL along approach and departure corridors, an altitude that would normally be a zero-foot grid for any other operator. Beyond the formal authorization, the team voluntarily issued a NOTAM—a Notice to Air Missions, the standard mechanism for alerting pilots to unusual activity or potential hazards in a given airspace—before the operation to ensure manned aircraft in the area were aware of the drone’s presence, even though their waiver didn’t require it. They also coordinated directly with Daytona Beach air traffic control to open and close the operation.
Inside the Aircraft
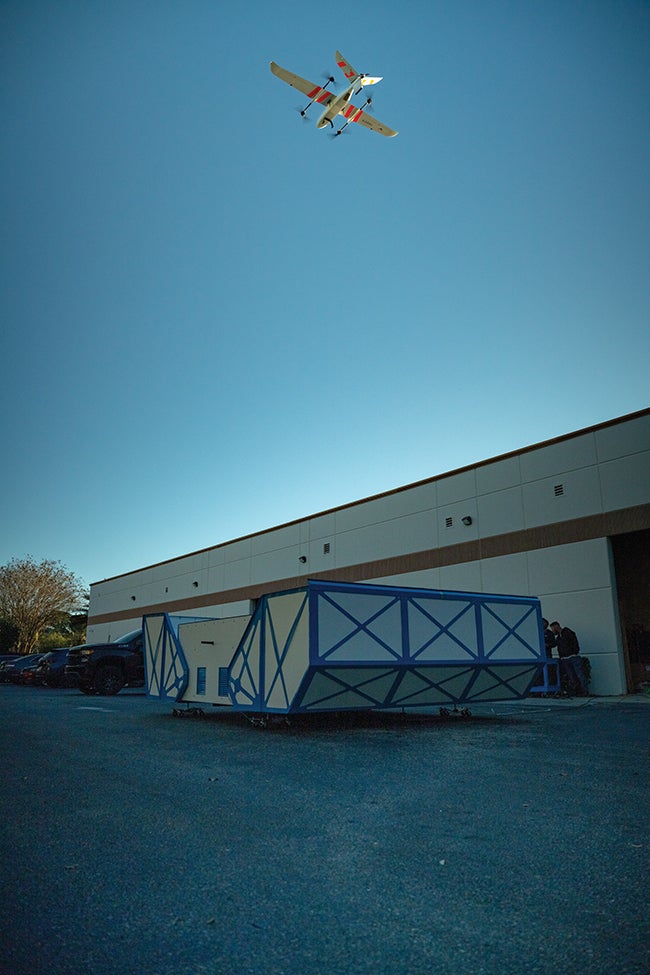
The Sentaero 6 is a fixed-wing VTOL (vertical takeoff and landing) unmanned aircraft system (Figure 3) manufactured in the U.S. It launches and recovers vertically like a multirotor drone, then transitions to efficient fixed-wing cruise flight for long-range operations. A multi-payload bay allows it to carry different sensor configurations depending on the mission.
 |
|
3. A Sentaero 6 launches above an EdgeDock station. The automated docking infrastructure is designed to enable persistent, networked drone operations across long infrastructure corridors. Courtesy: Censys Technologies |
For this flight, the aircraft carried a TV540 payload combining a LiDAR sensor with a 45-megapixel RGB camera. The LiDAR captures precise three-dimensional measurements of terrain, power conductors, and surrounding vegetation, while the camera provides high-resolution imagery for visual context. Together, they produce a dataset that lets engineers evaluate vegetation-to-conductor clearance in a digital environment rather than relying on what a person in a helicopter can see at speed.
How does the data quality compare? “The data is comparative and, in many cases, more detailed than manned flights due to proximity to the lines,” Davis said. “It is hard to beat ground crews standing at the line, but that is a method that does not scale through thousands of miles of assets.”
When the Weather Doesn’t Cooperate
The mission collected 95 gigabytes of RGB imagery and 45 gigabytes of LiDAR point cloud data. But getting there required adapting to conditions that didn’t match the forecast.
“Environmental conditions were the biggest surprise during the operation,” Davis recalled. “The winds were much higher and from a different direction than the forecast. It did not lead to any problems. It just requires monitoring, and this is the reason for the battery reserve.”
That battery reserve became a talking point of its own. The aircraft landed at the end of the mission with 20% battery remaining, slightly below the 25% operational safeguard set by the FAA. Adam Zirkelbach, Director of Marketing and part of the mission oversight team, explained that battery voltage is actively monitored through the heads-up display throughout the entire flight. “The 25% is a safeguard set by the FAA in case of emergencies allowing the operator ample time to think and execute a decision,” he said. On the Sentaero 6, 25% battery translates to roughly 30 minutes of remaining flight time. The team plans every mission assuming a 20-mph headwind for the entire route, a conservative approach that accounts for the aircraft’s wind rating of 20 mph sustained and 30 mph gusting.
Plan the Work, Work the Plan
Long-range BVLOS missions don’t begin at the launch site. As Davis put it: “A mission like this starts long before takeoff. The 21 hours of planning gave the crew the situational awareness and operational checkpoints needed to track progress and make decisions in real time.”
Those 21 hours broke down into site survey and corridor assessment (8 hours), flight route design and refinement (4 hours), ground risk analysis (4 hours), site selection and staging (3 hours), and regulatory coordination and airspace review (2 hours). The site survey included both ground and aerial assessments to map potential hazards, infrastructure proximity, and access points along the corridor. To manage the complexity of a flight covering nearly 80 miles of varied airspace, the team established three phase lines, that is, predetermined transition points along the route tied to specific operational conditions.
“Phase Line Red was called once we were clear of Runway 7R/25L where we could resume our 300 ft AGL,” Davis explained. “Phase Line White was located at SR44, basically where the remainder of the flight was straight and no longer over populated areas. Phase Line Blue was the ‘all clear’ point where we were past areas of cellular concern; it was also the handoff initiation point.”
One of the mission’s most consequential demonstrations happened at Phase Line Blue, when control of the aircraft was transferred between two operations teams—a proof of concept for how networked drone infrastructure would work in practice. Davis walked through the procedure: “Leading up to the handoff, we confirmed all telemetry values were identical between the two stations. After verification, which is initiated over full duplex communications, the observer role sends a request to assume control through the user interface, and the current pilot accepts the request. Once the changeover is complete, your icon changes to the observer but retains full situational awareness.”
This handoff was designed to mirror how a Sentaero 6 would transition control when flying from one EdgeDock station to another in a distributed network. This is the kind of operation Censys envisions at commercial scale.
What the Data Actually Shows
Once the aircraft was recovered, data was transferred directly from the sensor to a workstation via USB-C interface. The raw dataset was processed into.las format and prepared for ingestion into CensWise, Censys’s aerial intelligence platform, in approximately 4.5 hours. Automated LiDAR analysis then completed vegetation-clearance modeling across the entire 77.7-mile corridor in 39 minutes.
Mitch Rothstein, CensWise Product Manager, described the platform as a “detection and triage tool.” Engineers upload LiDAR files and a KML/KMZ file showing the transmission line route. The backend classifies points in the cloud, such as ground, vegetation, wires, and towers. It then traces the conductors, checks for vegetation inside a customizable buffer around the wires, groups problem points into events, and assigns severity levels based on proximity to conductors.
What the engineer sees when processing finishes is an Event Monitor with color-coded severity markers on a map view, sortable event lists, and detailed measurements including closest and average distance to conductors, vegetation height, area, and volume. A cross-section view shows a side profile of vegetation relative to conductors, which is critical context for making clearance decisions. “With data accuracy measured in a few centimeters, CensWise outputs are suitable for utility vegetation risk detection and engineering triage,” Rothstein said, though he noted that compliance determination requires utility-specific validation.
Drones vs. Helicopters: An Honest Comparison
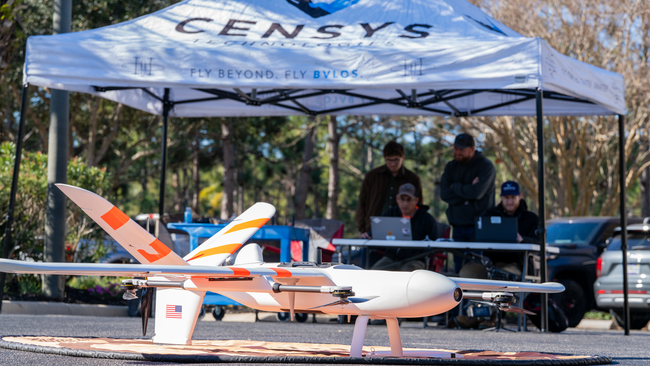
Zirkelbach offered a notably candid assessment of how drone-collected data stacks up against traditional methods. “For this specific inspection, both the Sentaero 6 drone [Figure 4] and helicopter would have captured a very similar data set,” he said. “They both have their pros and cons. Drones are cheaper and safer to operate, which allows for a higher cadence of inspection. On the flip side, helicopters can capture many data types due to their payload capacity and have advantages in areas with significant weather or terrain.” The advantage of drones, in other words, isn’t necessarily a single-mission data quality leap—it’s the economics of doing the same inspection far more often.
 |
|
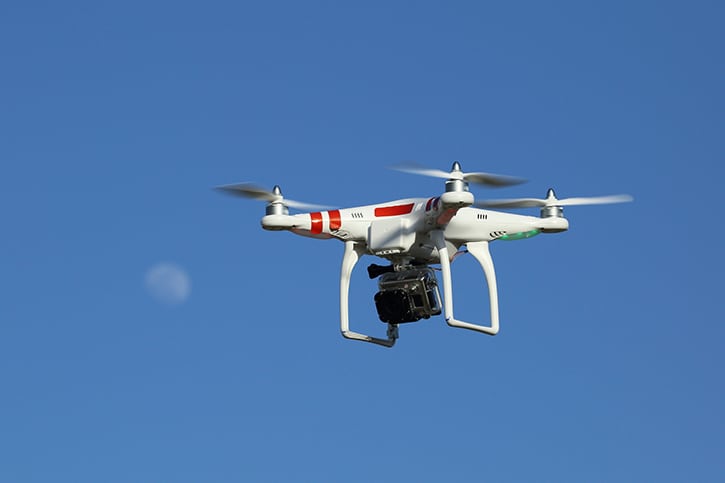
4. The Sentaero 6 aircraft launches and recovers vertically like a multirotor drone, then transitions to efficient wing-borne flight for long-range operations. Courtesy: Censys Technologies |
Kyle Miller, Censys’s Head of Infrastructure Markets, put hard numbers behind that argument. Helicopter inspection typically costs roughly $260 per mile for a utility paying about $80,000 per inspection cycle covering 600 miles, running twice per year. Larger utilities may spend up to $2 million annually at similar per-mile rates.
The Censys cost model, built from the DAB-to-Mims mission profile and scaled across a typical operational year, yields a cost per mile of $61.26, roughly a quarter of the helicopter benchmark. Total annual operating costs for a two-person team with one aircraft, payload, software, and support vehicle come to approximately $305,000. A single aircraft operating about 1,000 flight hours per year can produce about 20,000 miles of effective inspection coverage.
“ROI [return on investment] begins as soon as legacy inspection costs are reduced, and that applies across both large and small utilities,” Miller said. “The Censys model reduces that cost per mile while increasing inspection frequency and data availability, allowing many utilities to reach positive ROI in year one.”
The first execution of the DAB-to-Mims corridor required approximately 28 hours of total operational effort. But once the corridor was proven and procedures refined, repeat missions dropped to approximately 7 hours. Area analysis and flight planning typically only need to be completed once per year per flight area, so recurring missions focus primarily on execution and data collection.
Could that planning time approach zero with dock-based automation? Anastasio was careful not to overstate the case. “We cannot substantiate ‘nearly zero,’ ” she said. “What we can support is a significant reduction in recurring operational burden as operations move from crew-mobilized sorties to persistent dock-based networks. EdgeDock reduces repeated travel, site-access coordination, stand-by time, and repeated sortie-by-sortie paperwork.”
A realistic year-one deployment, according to Miller, starts with as few as two docks and one long-endurance aircraft, covering roughly 10,000 to 15,000 line miles annually. From there, adding docks expands coverage without proportional cost increases, turning the deployment into what he described as a persistent, networked aerial intelligence capability.
Beyond Vegetation: What Comes Next
The transmission corridor use case is just the starting point. “Within the utility industry, which is our majority customer base, our solution can be used for asset inspection, disaster response, security, and survey and mapping for new corridor construction,” Davis said. “We do see this solution scaling for long linear asset owners like pipeline, rail, roadways, borders, etc.”
The bottleneck to getting there isn’t any single factor. Anastasio framed it as a system-level challenge. “Inspection programs fail at scale when the whole ecosystem does not scale together—hardware, flight operations, compliance, data processing, and analysis,” she submitted.
The regulatory framework itself is evolving to help. Part 107’s waiver process is still largely one-off and location-specific, which makes it difficult to scale across thousands of miles of infrastructure. The proposed Part 108 framework is designed to move the industry from exception-based approvals to a standardized, performance-based model, enabling repeatable operations and supporting higher volumes of aircraft.
“The opportunity isn’t just to allow these operations,” Anastasio said. “It’s to make them predictable, scalable, and economically viable at enterprise scale.”
What 77 Miles Proved
The DAB-to-Mims mission was, in one sense, a straightforward demonstration flight: launch a drone, fly a corridor, collect data, process it, show results. But in the details—the airspace coordination, the phase lines, the mid-flight control handoff, the honest acknowledgment that helicopters still have advantages in certain conditions—it reveals something more significant about where infrastructure inspection is headed.
As CEO and co-founder Trevor Perrott put it: “Long-range BVLOS missions are not just about aircraft capability. They are about the systems, processes, and operational discipline that allow a team to safely scale aerial intelligence across real infrastructure corridors.” The 77 miles between Daytona Beach and Mims may have been a single mission, but the questions it answers, and the operational model it validates, point toward a fundamental change in how critical infrastructure is monitored, measured, and maintained.
—Aaron Larson is executive editor of POWER.