Creating a faster-than-real-time Energy Management System (EMS) is a huge challenge for the power industry. In order to be considered faster-than-real-time, the EMS must be capable of executing within a supervisory control and data acquisition sample cycle—typically five seconds. To date, no commercial EMS has been able to perform at such levels, but a new prototype system has achieved faster-than-real-time performance, and it’s been verified by provincial power system cases.
Faster-than-real-time Energy Management System (EMS) capability is key to maintaining awareness over power system events, helping prevent power system blackouts from occurring. For more than a decade, power system engineers have been unsuccessful in developing faster EMS applications for large-scale power systems. This project was designed to ultimately help operators in control centers to make power system operations more secure and cost-effective.
Addressing Technical Challenges
Technical challenges to curb EMS application computation efficiency include:
- ■ The power system becoming larger and larger to meet growing demand.
- ■ High renewable energy penetration, flexible alternating current transmission system devices, and high-voltage direct current transmission lines making power system models more complex.
- ■ Rapid fluctuations in power demand and supply combined with fast-response devices leads to more frequent and intensive recalculations.
The traditional Relational Database Management System (RDBMS) uses tables to store and manage data. The RDBMS stores the structured records and their attributes in an equal-length table, and maintains the database using the Structured Query Language (SQL). Ideally, structured tabular data of arbitrary complexity can be presented by the relational database. However, RDBMS has no flexibility to define the unstructured data set. For example, when the attribute numbers of two different records are unequal, the relational database will store the two different records in the separate tables.
The RDBMS is not very accommodating of data interconnections in a data set. To represent interconnection, the same attributes of records in the relational database are stored in different tables for creating the relations, and the relationship between the different records is established by querying the same attribute of the corresponding records in different tables. Therefore, adding or deleting records in the RDBMS requires updating all tables with associated shared attributes, commonly resulting in performance issues in query return time. Meanwhile, the performance benchmark study shows that compared to the performance of a Graph Database Management System (GDBMS), RDBMS takes much longer to support the attribute searching, optimal ordering, and depth-first (or breadth-first) search, which limits the efficiency of topology analysis, parallel computing, and result visualization for EMS applications.
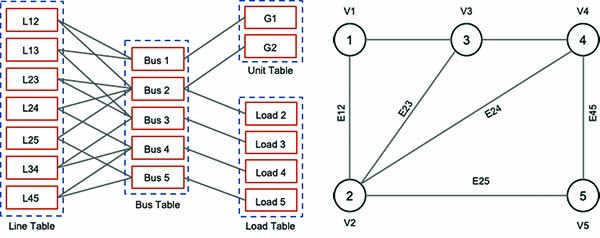
Unlike RDBMSs, graph databases model the power system using graph data structures for semantic queries with a set of nodes and edges (Figure 1). Unstructured attributes are stored in nodes and edges. The relationship between nodes and edges is self-defined in the graph. For online parallel computing of large-scale power systems, the GDBMS is more in line with the requirements of power system computing.
 |
|
1. Power system modeling by Relational Database Management System (RDBMS, shown on left) and Graph Database Management System (GDBMS, shown on right). Source: Global Energy Interconnection Research Institute North America (GEIRINA) |
Parallel computing is a breakthrough solution for speeding up EMS applications. Power system engineers have investigated different parallel computing approaches based on relational database structure to improve the EMS application computing efficiency, but until now have been unable to achieve faster-than-real-time EMS. However, using TigerGraph’s graph database and computing platform, the Global Energy Interconnection Research Institute North America (GEIRINA) has achieved a faster-than-real-time EMS prototype, verified by provincial power system cases.
The graph-based EMS is built on top of a graph analytics platform, which stores the power system model by the graph, dispatches the job by partitioning the graph, and performs parallel computing using the MapReduce program. A common functions library is implemented using the MapReduce strategy for power system applications. On top of the architecture, EMS applications are developed by calling the common functions.
There are two significant use cases that utilize the Massively Parallel Computing capabilities of the TigerGraph platform.
Graph Parallel Computing. Graph parallel computing includes graph nodal parallel computing and hierarchical parallel computing. In state estimation and power flow calculation, the tasks of matrix formation, right-hand-side correction vector calculation, and branch power flow calculation can be nodal parallelized. And the tasks of matrix factorization, and forward and backward substitution can be hierarchical parallelized.
Graph Parallel Computing Tasks. The core calculations that need to be solved for power system state estimation, power flow calculation, and contingency analysis can be mathematically stated as a set of linear algebraic equations. The most common and effective direct method to solve linear equations is Cholesky elimination. For nodal parallelism and hierarchical parallelism, the Cholesky elimination algorithm includes the following tasks: symbolic factorization to determine fill-ins, elimination tree formation, node partition, numerical factorization, and forward and backward substitution.
Achieving Faster-Than-Real-Time EMS
Conventionally, power systems are modeled using RDBMS in a collection of interlinked tables. As different components of power systems are stored in separate tables, they need to be linked together using shared key values to model the connectivity and topology of the power system. Connecting or linking across separate tables (database joins) reduces the total processing time for the power flow calculation by about 25% and for the power grid state estimation by about 35%, according to the results of the case study.
The standard approach to solving large-scale linear equations requires bulky, time-intensive matrix operations. Modeling a power system as a graph (instead of a matrix) represents connections and topology more naturally. No data preparation is needed, cutting the generally required time for power flow calculation and state estimation. Bus ordering and admittance graph forming are performed in nodal parallel (with all nodes performed at the same time to ensure the ordering sequence and admittance graph are in parallel).
Symbolic and numerical factorization and forward/backward substitution are performed in hierarchical parallel, with nodes partitioned into levels. Nodes at the same level are calculated in parallel, starting with the lowest level. Core calculations are all conducted on the graph, and solved values are stored as attributes of vertices and edges of the graph, rather than as unknown variables in the vector or matrix.
In the conventional approach, power system problems are solved as unknown variables and assigned to the X vector. To visualize the solved value, a mapping process is used to link the unknown variable to displays.
Using technology from TigerGraph, solved values are stored as attributes of vertices and edges on a graph—forgoing the need for a mapping process. According to the test case, output visualization takes about 70% of the total time for power flow calculation, and 28% for state estimation when using the conventional approach. With TigerGraph’s graph database and graph computing, that portion of the time is eliminated.
Table 1 summarizes test results of the faster-than-real-time EMS as compared to D5000, the widely used commercial EMS covering most control centers in China and many other countries.
 |
|
Table 1. The results shown in this table are from an Energy Management System (EMS) test conducted on an actual provincial 2650 bus system. Values shown are in milliseconds (ms). Source: GEIRINA |
The total execution time of the three major EMS applications—state estimation, power flow, and contingency analysis—is a little more than one second combined, which is much less than the SCADA sample cycle standard of five seconds. With the help of TigerGraph, the first viable faster-than-real-time EMS solution for commercial use was achieved.
The developed graph-based EMS has been installed in a provincial control center in China processing a model of 2643 buses and 3185 branches. The EMS has been continuously running every five seconds using real SCADA telemetered data since August 2018. An example of the graph-based EMS main display is shown in Figure 2.
 |
|
2. A screenshot of the graph-based EMS main display is shown here. Source: GEIRINA |
Successful Collaboration
Creating a faster-than-real-time EMS has been considered the holy grail for power management, especially as any power outages directly affect the productivity and economic output, or gross domestic product, of the nation. Such a system can identify mismatches between power demand and supply, lower power consumption for non-critical parts of the grid, and divert power to higher priority areas for industrial output and national security—and accomplish all of this in under one second.
GEIRINA teamed with Hsiao-Dong Chiang, Professor of Cornell University; Joe Chow, National Academy of Engineering, Institute Professor of Rensselaer Polytechnic Institute; Xiaochuan Luo, technical manager at the ISO-NE; Tongxin Zheng, technical director at the ISO-NE; and several other respected Institute of Electrical and Electronics Engineers (IEEE) fellows/professors to propose the creation of a faster-than-real-time computing task force to the Technologies and Innovation Subcommittee at the IEEE Power and Energy Society General Meeting (PES GM) 2018 conference in Portland, Oregon. The proposal was approved. ■
—Guangyi Liu, PhD is chief technology officer of GEIRINA.
For more information, the following research papers have also been published by Dr. Guangyi Liu:
- Power Flow Analysis Using Graph based Combination of Iterative Methods and Vertex Contraction — https://www.researchgate.net/publication/327755833_Power_Flow_Analysis_Using_Graph_based_Combination_of_Iterative_Methods_and_Vertex_Contraction
- Power Flow Analysis Using Graph based Combination of Iterative Methods and Vertex Contraction Approach — https://www.researchgate.net/publication/327464787_Power_Flow_Analysis_Using_Graph_based_Combination_of_Iterative_Methods_and_Vertex_Contraction_Approach
- Exploration of Bi-Level PageRank Algorithm for Power Flow Analysis Using Graph Database — https://www.researchgate.net/publication/327464793_Exploration_of_Bi-Level_PageRank_Algorithm_for_Power_Flow_Analysis_Using_Graph_Database
- Graph Computation based Power Flow for Large-Scale AC-DC System — https://www.researchgate.net/publication/327402189_Graph_Computation_based_Power_Flow_for_Large-Scale_AC-DC_System
- Evolving Graph Based Power System EMS Real Time Analysis Framework — https://www.researchgate.net/publication/324958964_Evolving_Graph_Based_Power_System_EMS_Real_Time_Analysis_Framework
- Graph based Platform for Electricity Market Study, Education and Training — https://www.researchgate.net/publication/324435978_Graph_based_Platform_for_Electricity_Market_Study_Education_and_Training
- CIM/E Oriented Graph Database Model Architecture and Parallel Network Topology Processing — https://www.researchgate.net/publication/323846262_CIME_Oriented_Graph_Database_Model_Architecture_and_Parallel_Network_Topology_Processing
- Graph-based Preconditioning Conjugate Gradient Algorithm for N-1 Contingency Analysis — https://www.researchgate.net/publication/323694387_Graph-based_Preconditioning_Conjugate_Gradient_Algorithm_for_N-1_Contingency_Analysis
- Exploration of Graph Computing in Power System State Estimation — https://www.researchgate.net/publication/323694538_Exploration_of_Graph_Computing_in_Power_System_State_Estimation