When the blades of individual Kaplan turbines are not continuously adjusted to achieve peak efficiency, the result is non-optimal performance and unnecessarily high mortality of downstream migrating fish. However, a new best-science method of index testing is available, which simultaneously improves fish passage of downstream migrants, increases service life of existing turbine-generating equipment, improves power generation, and increases revenue from power operations.
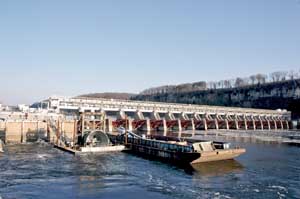
The U.S. Army Corps of Engineers (USACE), Bureau of Reclamation, and Bonneville Power Administration (BPA; collectively, the Agencies) operate, maintain, and transmit hydroelectric power from 14 federal multiple-purpose dams and related facilities located throughout the Columbia River basin in Idaho, Montana, Oregon, and Washington. On Sept. 30, 2016, the Agencies published a “Notice of Intent To Prepare the Columbia River System Operations [CRSO] Environmental Impact Statement [EIS]” in the Federal Register. The Agencies use the EIS process to assess and update their approach for long-term system operations and configuration.
A variety of system problems could be solved by index testing Kaplan turbines installed in the various facilities. Indexing is essentially tuning a Kaplan turbine to maximize its operating efficiency.
A comprehensive understanding of this technology involves knowledge of how hydraulic reaction turbines function in general, and specifically how those in the Columbia and Snake Rivers are operated. This indexing technology applies to both Kaplan and Francis-type turbines, but the greater benefit is derived from its application to the Federal Columbia River Power System (FCRPS) Kaplan-type turbines.
Kaplan Turbine Theory
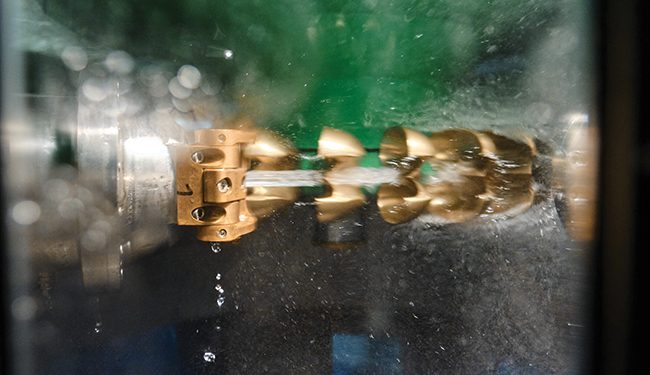
All hydraulic reaction turbines physically operate by imparting a whirl component to the flow in their spiral or semi-spiral case, and then the turbine runner (rotating element) straightens out this flow. This mechanical change of fluid angular momentum induces a torque in foot-pounds on the turbine shaft. The rate at which this change is done becomes foot-pounds per second, which is mechanical power.
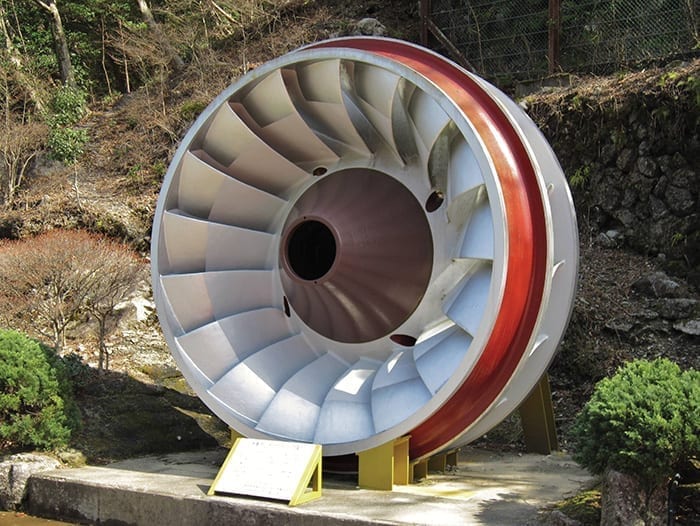
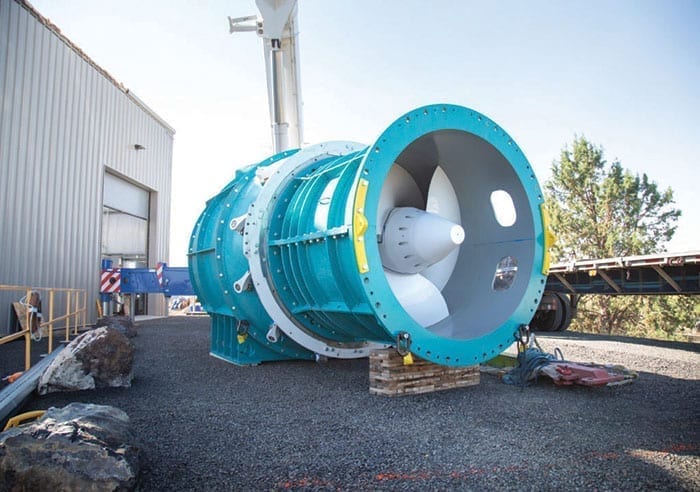
The USACE has more than 100 Kaplan turbines in the FCRPS. These low-head turbines discharge the greatest flow per MW and are the turbines involved in downstream fish passage. These Kaplan’s are vertical-shafted, variable-pitch, propeller-type turbines developed by an Austrian professor, Dr. Viktor Kaplan, in the 1920s. He modified a standard fixed-blade propeller turbine so that the pitch angle of the blades could be varied continuously while the machine was in operation.
The head (difference in upstream and downstream elevations or pressure) and wicket gate opening (valve or vane opening) determine the individual turbine’s volumetric flow rate and the unique angle at which the corresponding water velocity approaches the leading edges of the turbine’s blades. The pitch angle of the blades must be continually adjusted to match the ever-changing angle of this flow-velocity vector in order to maintain maximum efficiency.
At maximum efficiency, there is the least chance that a downstream migrant fish would experience blade strike, grinding, or abrasion. Because these three are among the five highest causes of fish mortality in Kaplan turbines, operating at maximum efficiency achieves the highest total survival of downstream migrating fish for any head and power output.
Rarely Done—Testing Offers Benefits
The basic problem with fish mortality on the Columbia and Snake River systems is that very few of the USACE’s Kaplan turbine governors are able to properly control their turbines to continuously achieve this optimum blade angle. This is due to three factors:
- ■ Every turbine, even those manufactured under the same contract (same manufacturer), is hydraulically different from every other turbine, and therefore, the blade pitch angle for optimum efficiency varies from every other turbine for the same head and wicket gate opening.
- ■ Less than one out of every 10 of the USACE’s Kaplan’s on the Columbia River system is ever field tested to learn its true, unique and optimum blade angle.
- ■ Most USACE governors have dead-band limits on blade positioning errors that are many times larger than allowed by industry specifications for commercial governors.
The method to conduct a relative efficiency field test—or index test—to determine hydraulic characteristics was developed in the 1920s by a New York utility. All Kaplan turbines in the Columbia River system are instrumented and have the embedded piping needed for index testing.
This testing involves some field work and financial expense. The budgetary figure in 2006 for a Kaplan index test at a single head was $25,000, which is why so few turbines are ever index tested at even one head during their roughly 70-year operating life. This is despite the fact that it has been repeatedly demonstrated that index testing pays for itself over an extremely short period of time through the additional electrical energy produced and extended operating life before refurbishment is needed.
Furthermore, several fish survivability tests conducted on newly indexed and efficiency-optimized Kaplan turbines have found 48-hour hold time mortality rates of less than 3%. This mortality is lower than the mortality rates, under the same test conditions, of even the best powerhouse fish collection systems, or the loss from being discharged through the gates of a spillway.
Index Test Box
About 25 years ago, a device called an Index Test Box (ITB) was invented. It is capable of performing unattended index tests. In other words, it’s operated by simply plugging the unit into a governor and recording performance data while the generating unit remains in normal operation.
The ITB utilizes a constant power testing method that does not cause wide swings in flow and power like conventional index testing methods do. BPA evaluated this device, tested it at Portland General Electric’s Hydro Plant 2, and found it worked perfectly.
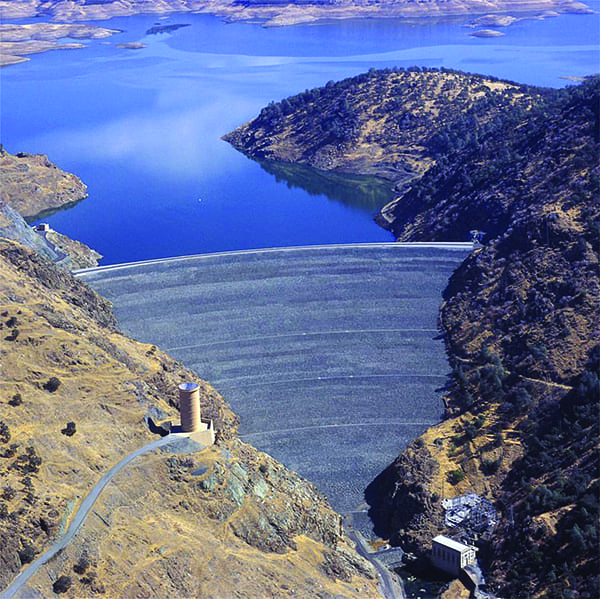
Over the intervening years and culminating in 2016, the inventor of the ITB perfected a method of achieving the most accurate of index testing results, without even having to actually conduct any field tests. This newest technique has been demonstrated at a privately owned, single-unit Kaplan powerhouse that uses the forebay at Dorena Dam in Oregon, which is owned by the USACE. This method needs only the data normally recorded on the station’s supervisory control and data acquisition (SCADA) system.
A software program from the ITB is used to sort and correlate this data into conventional tabular format, and then a separate software program, developed by students at the Oregon Institute of Technology in Wilsonville (OIT), analyzes this data exactly as if it had been measured by field index tests.
Although Similar, Not the Same
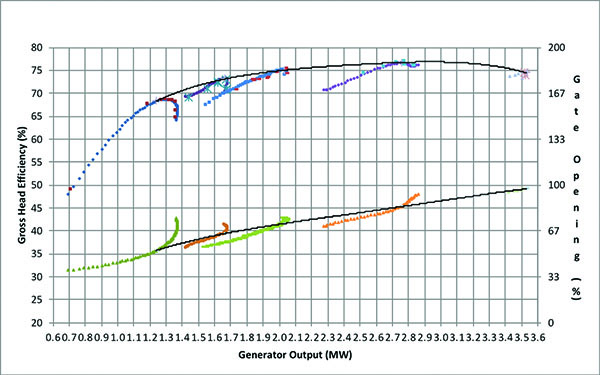
In Figure 1, the absolute efficiency profiles are shown for the first five original turbines at The Dalles Dam, located near The Dalles, Oregon. These graphs were determined by current meter tests in the late 1960s. They show that even though these units are nominally the same, that is, made by the same manufacturer, under the same contract, and using the same model-derived cam curve, they perform as completely different units.
 |
|
1. The efficiency profiles shown here are for units made by the same manufacturer under the same contract, yet peak efficiency varies by as much as 9% from unit to unit. Source: Lee H. Sheldon |
The difference in peak efficiency is about 9%, and even the difference in the location of peak efficiencies occurs over several megawatts. In other words, the governor of each and every turbine needs to be programmed with its own unique, optimized, individual cam curve derived from index tests, if that powerhouse is to maximize its total efficiency and the survivability of downstream migrant fish.
Non-Optimum Cams
Index testing often identifies unusual Kaplan turbine operating characteristics. For example, a traditional field index test, utilizing eight fixed-blade angles, was conducted at the Lower Granite Dam Unit 2 located near Pomeroy, Washington. The peak efficiency was expected at about 129 MW, if the optimum individual cam curve had been installed in the machine. However, in this particular unit, that was not the case. At the time of the test, the relative efficiency decreased at about 104 MW, from an optimum of 547,000 lb/sec-ft0.5 to 536,000 lb/sec-ft0.5, a change of 2%.
That 2% did not simply disappear, but the lost energy it represents had to be destroyed within the fluid column before or at its discharge from the draft tube exit. If it were not destroyed, the tailwater would have to exist at two different elevations, an obvious impossibility. 104 MW equals about 139,466 hp, and 2% of that is approximately 2,789 hp. Therefore, 2,790 hp (power roughly equivalent to the combined power plants in two Abrams Mark 1, A1, main battle tanks) must be destroyed in heat, turbulence, and vibration within a draft tube distance of about 100 feet. Thus, it’s no wonder that downstream migrant fish emerging from a draft tube exit of a FCRPS Kaplan turbine will be completely disoriented and subject to predation, if the unit isn’t operating at its optimal efficiency.
The cam curve details shown in Figure 2 are from the Lower Granite Dam Unit 2 field index test. The test was conducted as accurately as the technique allowed at that time. The black line is the optimum cam curve determined by the index test points of tangency (the dark blue dots). There is a very slight scatter to the blue dots, which is typical of the uncertainty of the traditional method of field index testing.
 |
|
2. This chart shows the existing and optimum cam curves for the Lower Granite Dam Unit 2 field index test. The as-found cam curve (light blue) shows as much as a 23.3% positioning error from optimum in some areas. Source: Lee H. Sheldon |
The as-found cam curve (the light blue line) shows the permanently installed cam at the time of the test. Significantly, it is far removed from the optimum curve. Its wicket gate servomotor has a lift-off point at gate opening 10.5% smaller than the optimum, and the index test determined the permanently installed cam had a maximum blade positioning error of 3.5 degrees too steep. As this machine has a total blade movement of only 15 degrees, this represented a blade-positioning error of 23.3%.
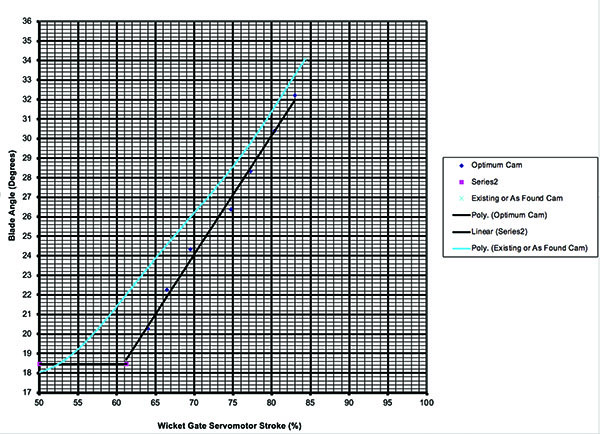
The same format for an index-test derived cam curve from a different test on a different Kaplan turbine at a different USACE Columbia River powerhouse is shown in Figure 3. The permanently installed (or as-found cam) is shown in dark blue dots with a dark blue line, and the optimum cam curve derived from the index test is shown with pink dots and a pink line.
 |
|
3. This chart shows the as-found (dark blue) and optimum (pink) cam curves obtained during index testing on the John Day Dam Unit 9 near Rufus, Oregon. As often is the case, the as-found cam was not ideal. Source: Lee H. Sheldon |
The plot shows both lines have about the same lift-off point, but the as-found cam positions the blades about 2 degrees flatter for the same wicket gate servomotor stroke, or about a 4.5% wider wicket gate opening for the same blade angle. The green line, labeled verification test, is from a post index (or check) test to verify the governor is following the replacement cam within its tolerance band.
Large Dead-Band Ranges Are Inefficient
By design, USACE governors have a programmable dead-band error on blade positioning to de-sensitize the governor closed-loop to prevent unstable behavior. This causes excessive blade positioning error, and increased turbulence and shear forces in the water column that are harmful to fish.
At McNary Dam, this variable error band had been increased to +1.0 degree (+6.5%) by the operators at a time when the USACE’s Hydroelectric Design Center’s specified dead-band setting for all generic data acquisition and control system 3-D cams was +0.5 degrees (+3.2%) and the industry standard from ASME and IEEE was +0.078 degree (+0.5%). The ITB field test identified this difference. McNary was later brought in-line with other USACE Kaplan plants with a +3.2% dead-band.
The results of the previously mentioned Dorena index test at 69 feet gross head are shown in Figure 4. As noted, this assessment was conducted using the latest index testing method using only the data recorded on the station’s SCADA system. In the upper portion, the relative efficiency profiles of five individual fixed-blade angles are shown. The tangent line connecting their tops is the relative efficiency profile. It shows that peak relative efficiency occurs at 2.95 MW.
 |
|
4. An index test conducted using the latest method, which uses data recorded from the unit’s supervisory control and data acquisition system, is shown here. The relative efficiency peak occurred at 2.95 MW. Source: Lee H. Sheldon |
On the fixed-blade angle efficiency curves, the individual data points are plotted in overlay. Actually, these are not “individual” data points, but are averages of approximately 50 truly individual data “steady-state” points. As noted, there is virtually no scatter or “uncertainty” to the spread of the data. Furthermore, the resulting blade-to-gate curve, or cam curve, from the points of tangency on the fixed-blade profiles was also plotted, and again, there was virtually no uncertainty to this plotted data, which demonstrated the extreme accuracy of this new, very inexpensive method of index testing from nothing more than the SCADA data recording.
In another test, the maximum effect of the differences in the individual efficiencies of the original 14 turbines at The Dalles Dam were plotted. The total powerhouse efficiency was analyzed assuming the next available unit to be put online as load demand increased was the most-efficient remaining unit, and it was also examined assuming the next unit to be put online was the lowest efficiency unit. At a powerhouse load point of 400 MW, the difference in total powerhouse efficiency between the two scenarios was about 2.5%. Assuming energy is worth $0.05/kWh, this difference represents about $4.3 million per year in lost revenue. That demonstrates the value of a subject referred to as Type 2 Optimization.
Students at OIT developed a computer program to provide for the optimum load sharing of individual units in a powerhouse to maximize the revenue at any load setpoint. They received a grant from BPA to demonstrate their program, which they did at Grand Coulee. Their results showed Grand Coulee’s energy generation could be increased 1.5% using the same amount of water at the same gross head.
In conclusion, the problem causing unnecessarily high mortality of downstream migrating fish in the Columbia and Snake Rivers is that the blades of the individual Kaplan turbines are not continuously adjusted to their optimal position to achieve their peak individual efficiencies. The survivability of downstream migrants is a direct function of the hydraulic efficiency of the turbines.
The means have existed since Kaplan turbines first came on the scene to provide unit governors with the ability to continuously operate the turbines at optimum efficiency. Since 2016, a new best-science method of index testing has been available to achieve this continuous optimum efficiency on each individual turbine with a minimum of cost, effort, and time. ■
—Lee H. Sheldon, PE is a hydropower engineer with 50 years of experience. He has published 33 technical papers and a college textbook on hydropower engineering, and has worked on every federal hydroelectric project in the Pacific Northwest, among others. He is currently a professor at OIT, where he teaches hydropower engineering and fluid mechanics.