Enhanced condenser tube designs can significantly improve the heat rate and performance of fossil and nuclear plants. Using the optimum number of tubes and replacement tube sheets will cost more than simply replacing plain tubes. However, the investment’s simple payback is measured in only weeks, which builds a strong case for using an enhanced tube design as part of your next condenser overhaul.
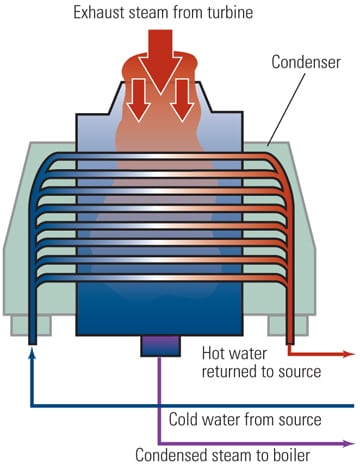
The vast majority of electric utility plants operate with the Rankine cycle, which uses a turbine-generator to produce electric power. One of the limitations of this cycle is that the condenser cooling water temperature directly affects plant efficiency and the power generated. Colder water during the winter months yields a higher power output and, conversely, plant output is reduced when the condenser water temperature rises during the summer. In addition, plant output is more sensitive to high turbine backpressure (in summer months) than to low backpressure (in winter months).
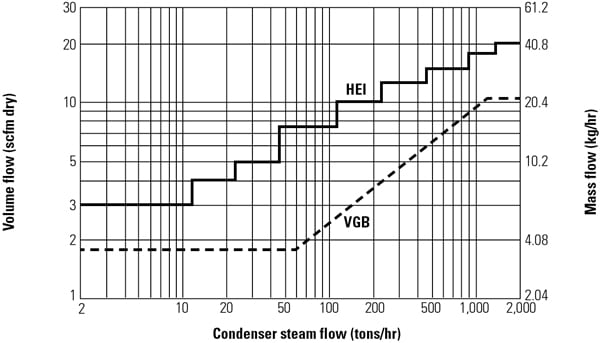
As you will see shortly, the effect of condenser water inlet temperature is strongly influenced by the shape of the "turbine backpressure curve," as shown in Figure 1. Note that the smallest incremental improvement occurs at the lowest backpressure, where the curve is reasonably flat. Conversely, the greatest incremental improvement will occur at the higher condenser inlet water temperature conditions. Therefore, fossil and nuclear plants experience the greatest benefit of reduced condenser water temperature in the summer months during peak demand season.
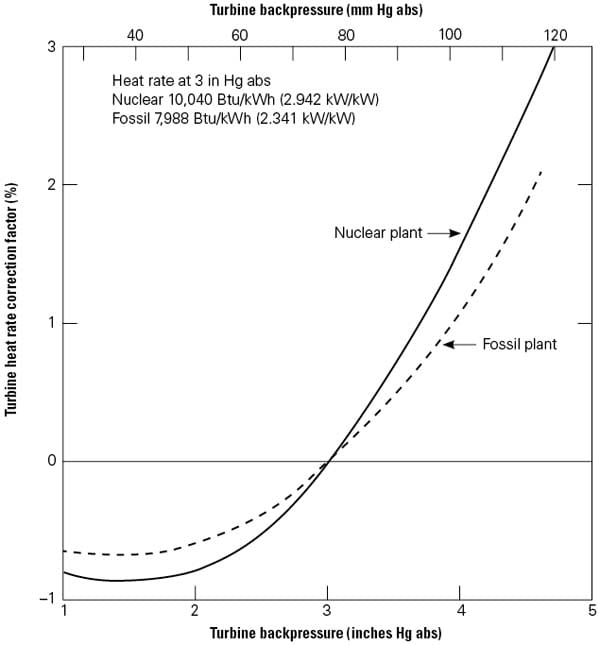
1. Changes with temperature. This turbine heat rate correction factor curve specifies 3 in. HgA as the standard performance condition. A turbine heat rate factor must be applied when the turbine backpressure changes as a reaction to condenser cooling water temperature changes. Note the differences between the response of a typical fossil and nuclear plant. Source: Dr. Ralph L. Webb
In addition to lower cooling water temperatures, advanced technology condenser tubes with special surface geometries on the inner and outer surfaces will yield a higher overall heat transfer coefficient (U) than a plain tube condenser, increasing the heat transfer between the steam and cooling water, and thereby increasing power output and reducing plant heat rate. Such a special surface geometry tube is called an "enhanced tube."
There are practical and commercially available enhanced condenser tube geometries that will yield a U-value increase of approximately 40%. These tubes are available to any power plant that operates on the Rankine cycle using condenser water from any source (lake, river, or cooling tower). An increased U-value means that a lower turbine backpressure factor (Figure 1) is required for a given condenser water temperature, resulting in higher plant efficiency and power output.
Enhanced Condenser Tubes
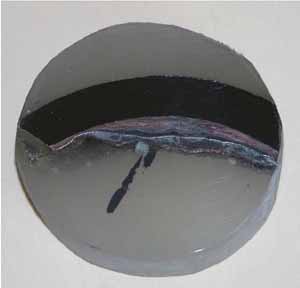
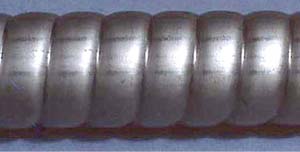
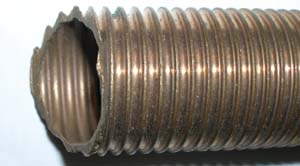
A special enhanced tube called a "corrugated tube" was used in the U.S. to re-tube existing utility steam condenser bundles at several Tennessee Valley Authority plants in the 1990s. The corrugated tube has a single helix configuration. The specific tubes tested are known as Korodense and were manufactured by Wolverine Tube (Figure 2a). This tube results in a 1.80 factor water-side heat transfer enhancement, 2.25 friction factor increase, and 30% steam side enhancement, relative to a smooth tube.
2a.
2b.
2c.
2d.
2e.
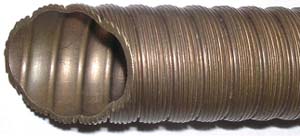
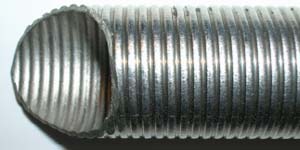
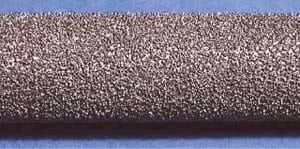
2. Enhanced condenser tube options. A number of horizontal integral-fin tubes have been developed for steam condensation. Some notable examples are (a) stainless steel Wolverine Korodense, (b) stainless steel Wieland NW-16, (c) copper-nickel Wieland 11-NW, (d) UOP attached particle tube, and (e) Yorkshire MERT (Multiply Enhanced Roped Tube). Courtesy: Dr. Ralph L. Webb
In an article written in 1984, "Enhanced Tubes in Electric Utility Steam Condensers in Heat Transfer in Heat Rejection Systems," published by the Heat Transfer Division of the American Society of Mechanical Engineers, I wrote about a simulation analysis of re-tubing an existing plant with various enhanced condenser tube geometries. This analysis included a corrugated tube, and other geometries, whose performance was theoretically estimated. The analysis defined the performance and economic benefits of condensers using enhanced tubes. The analysis was performed using the turbine performance data from Arkansas Nuclear One (ANO-1) Unit 1. The results of that analysis showed that enhanced condenser tubes were economically justified in fossil and nuclear plants.
Between 1990 and 1992, additional research under sponsorship of the Electric Power Research Institute and the U.S. Department of Energy resulted in specific enhanced tube geometries for application to electric utility steam condensers. These tubes had enhancement on both the steam and water side. The tubes were designed in partnership with Wieland-Werke AG and Wolverine Tube, which manufactured the prototype tubes for testing. Figure 2 shows the tubes that were manufactured and tested for steam- and water-side performance.
The previous work has shown that certain enhanced tubes can provide performance and economic benefits for electric utility plant condensers. A recent update of that 1984 analysis using the same ANO-1 data once again illustrates the advantages of enhanced tubes in fossil and nuclear condensers. The following analysis uses data for the Wieland NW-16 tube (Figure 2b). The calculation procedure is included so a plant engineer could reproduce the analysis for a particular plant that might be considering the use of enhanced condenser tubes.
Nuclear Plant Analyzed
The analysis was performed for a 946-MWe nuclear plant using design specifications provided by Gilbert Commonwealth Associates (GCA). The plant specification rated the plant at 946.3 MW with 3.0 in HgA turbine backpressure (Psat). The curve "nuclear" in Figure 1 is the backpressure correction curve used in this analysis. As shown in Figure 1, the rated heat rate (HR = Qh /W) is 2.942 kW/kW, where Qh is the heat supplied to the reactor and P is the rated plant output. For a fossil plant, the ratio would represent the fuel heat input in equivalent kW units divided by the rated plant output.
The condenser used for the example calculations is the ANO-1 condenser, but configured with 23,150, 28.6-mm OD stainless steel tubes 13.4 m long. The condenser water flow rate at the rated condition is 30.65 m3 /s based on the GCA design data. The design water velocity is 2.29 m/s. The ANO-1 condenser was originally built with 28.6-mm OD admiralty tubes having 19,608 tubes per condenser shell. The condenser was re-tubed in 1999, which involved complete reconstruction of the four condenser tube bundles that served the two low-pressure turbines. This condenser reconstruction used 25.4-mm OD titanium tubes that were 13.5 m long. However, the stainless steel tubes assumed in this case study are representative of the condenser tubes now used by many nuclear and fossil plants in the U.S.
Calculation Procedure
The following sections outline the step-by-step calculation procedure shown in Table 1 for calculating the potential plant efficiency and output that may be obtained from using enhanced turbines in this plant condenser.
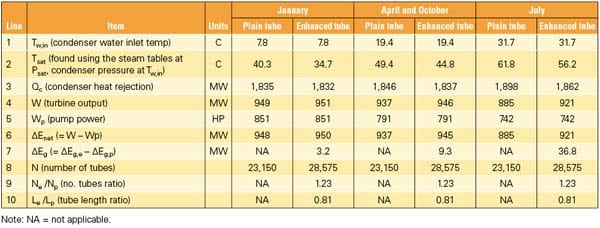
Table 1. Comparison of enhanced vs. plain tube condenser (bundle replacement). Source: Dr. Ralph L. Webb
Turbine Output and Condenser Load. Using the heat rate correction factor found in Figure 1 at the plant rating condition, first calculate Qh = 2.942 * 946.3 = 2,784 MW. This heat input is assumed to be constant for the present calculations, where the plant is operating at different condenser saturation pressures (Psat). Calculating the heat rate (HR) at other values of Psat is easily performed using the heat rate correction factor (HRC) given in Figure 1.
Tsat is then found from the steam tables and added to line 2. The condenser heat rejection (Qc) is given by Qc = Qh – W, where W is the turbine output power (line 3 in Table 1). At the rated condition 76.2 mm Hg (3 in. Hg), Qc = 2,784 – 946.3 = 1,837.7 MW. At any known turbine backpressure, the HR = 2.942 * (1 + HRC/100). Using this HR with Qh = 2,784 MW, one may calculate the turbine output (W) and the condenser heat rejection (Qc = Qh – W) (line 4).
Objective Function and Constraints. The calculations are performed for two cases: a tube-for-tube replacement and a bundle replacement having Ne Le /Np Lp = 1 with fixed condenser flow rate where N = the number of condenser tubes, L = the length of the tubes, the subscript p represents the original plain or smooth tubes, and the subscript e represents the enhanced, replacement tubes. For both cases, the constraints are:
-
Fixed heat input to turbine (Qh).
-
Fixed pumping power (P) and condenser water flow rate ( m).
-
The analysis assumed that the re-tubed condenser uses titanium tubes of the same OD as the original plant design and 0.7-mm wall thickness.
By replacing the plain tubes with enhanced tubes, the UA value of the condenser is increased, where A is the heat transfer area and U was defined previously as the overall heat transfer coefficient of the tubes. Because the enhanced tubes have a higher friction factor, and some have a smaller cross-sectional flow area, the balance point on the circulating water head versus flow curve (Figure 3) will occur at a reduced water flow rate for a tube-for-tube replacement.
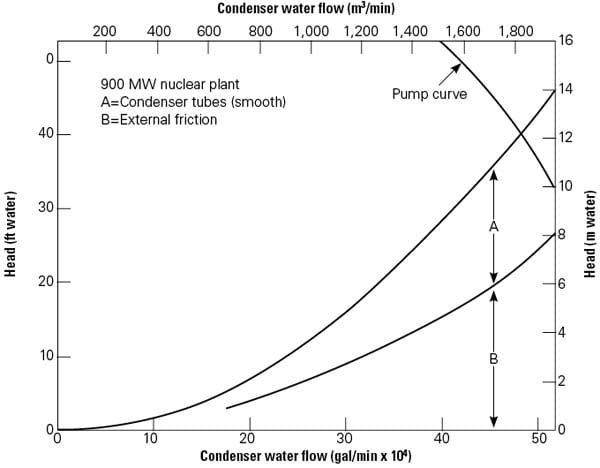
3. System performance curves. The design pump and system head versus water flow rate for Arkansas Nuclear One, Unit 1 is illustrated. Note that the enhanced tubes have a higher friction factor (caused by a smaller diameter) that reduces the cooling water flow should like numbers of tubes be replaced. In this figure, the original design system friction balance point is off the right side of the figure, at about 600,000 gpm. With a tube-for-tube replacement, the condenser water flow will decrease to approximately 480,000 gpm. Therefore, to maintain like condenser pump system performance, additional enhanced tubes must be added to the condenser. Source: Gilbert Commonwealth Associates
Using the friction factor versus Reynolds number characteristic of a given enhanced tube, the total system friction head (pressure) versus flow characteristic was developed (Figure 3). The pump head versus flow characteristic was curve-fitted to a polynomial. Simultaneous solution of these two equations yielded the condenser water flow rate through the enhanced tube condenser. These figures show the system characteristic for the smooth tube condenser design and the friction head characteristic of system, less the head loss in the condenser tubes. Examination of the pump curves for the two plants shows that the percentage of the total head loss that occurs in the condenser tubes is 45%.
Water-Side Heat Transfer Coefficient. After calculating the cooling water flow rate, the heat transfer coefficient (hp) on the waterside coefficient of the plain tubes is calculated using the well-accepted Petukhov correlation for plain tubes. The waterside coefficient of the plain tubes is based on test results and is given as the smooth tube value multiplied by an enhancement factor (Ehi = he /hp). Most heat transfer references will provide details on calculating hp. The tube supplier can provide data on he. A value of Ehi = 1.55 is used for the Figure 2b Wieland NW-16 tube.
Water-Side Fouling Factor. A value of Rf = 4.4 * 10– 5 m2 -K/W (0.00025 hr-ft2 /Btu) was used in the calculations. This corresponds to a "cleanliness factor" of 0.70.
Condensation Coefficient. The HEI Standard for Steam Surface Condensers (1995, 2002) outlines a method for calculating the overall single-tube heat transfer coefficient (U) for steam condensation in electric utility steam condensers. The calculated U is in close agreement with that calculated using the horizontal tube Nusselt equation for the steam condensation coefficient, as given in many texts on heat transfer:
![]()
The titanium alloy used here is ASTM B338, having 21.6 W/m-K thermal conductivity.
Condensing Temperature (Ts). The inlet cooling water temperature is known for each month of the year at ANO and therefore the condensing temperature (Tsat) can be determined. The condenser heat rejection (Qc) rate at any Psat is given by
![]()
where HRC is the heat rate correction factor (%) obtained by curve-fitting the correction factor (Figure 1) as a function of Psat.
Condenser Thermal Parameters. The heat exchanger thermal effectiveness (e) is calculated by e = 1 -e-NTU where
![]()
The condenser heat rejection is given by
![]()
where Tw,in is known for each month of the year. The calculation procedure requires iteration of Qc and Tsat (which is a direct function of Psat — found in the steam tables). To obtain annual average values, this calculation is performed for each month of the year using the known Tw,in for each month of the year.
Condenser Pumping Power. Because of the different balance point on the pump curve, the pump power changes. The condenser pumping power (line 5) is given by
![]()
Increased Net Generation. Using the calculated values of W and Qc, the incremental generation rate ΔEg (MW) made possible by the enhanced tube geometries is determined using the calculated values of turbine output (W) and the pumping power (Wp). The new generation output is Wnet = W – Wp, assuming the main steam flow is held constant (line 6).
The net increased generation rate provided by the enhanced tube condenser (relative to the plain tube condenser) is ΔEg. The ΔEg = We – Wnet,p, where subscripts e and p refer to the enhanced and plain tube respectively (line 7).
Calculated Results
Calculations were performed for two cases: a tube-for-tube replacement with fixed pumping power and a bundle replacement having Ne Le /Np Lp = 1 with fixed condenser flow rate and pumping power, as discussed earlier.
Tube-for-Tube Replacement. The analysis showed that the tube-for-tube replacement will provide significantly lower ΔEg than the bundle replacement. This is because the tube-for-tube replacement results in a reduced condenser water flow rate. For the Figure 2b NW-16 tube, the flow rate reduction is 19%. This reduced flow rate causes the condenser to operate at higher thermal effectiveness, which degrades the condenser performance, relative to the second case, which holds water flow rate constant. For the NW-16 tube, the resulting annual average ΔEg is 9.87 MW.
Tube Bundle Replacement. In this case, the total length of all tubes in the enhanced tube condenser is the same as for the plain tube design. However, the design maintains the total water flow rate the same as for the plain tube design by using more tubes (of a shorter length) in the enhanced tube condenser. For the NW-16 tube design, the enhanced tube condenser has 23% more tubes than that in the plain tube condenser (lines 8, 9, 10).
Also remember that the condenser inlet water temperature changes for each month of the year. In this analysis, results were calculated for four representative months: January, April, July, and October. These results were then used to obtain the annual average values.
The calculated results are shown in Table 1 in the order of the calculation procedure just described. Calculated results are shown for January, April and October (combined because the cooling water inlet temperatures are the same), and July for both the plain and enhanced tube condenser designs. The key performance number shown in Table 1 is ΔEg, which is the increased net generation rate provided by the enhanced tube condenser design. The greatest ΔEg occurs in July at 36.8 MW. The smallest ΔEg occurs in January and is 3.2 MW. The reason the January ΔEg is so small is because the heat rate curve (Figure 1) is relatively flat at the low condensing pressure (Psat) of January. Hence, the warmer the condenser water inlet temperature, the greater the benefit of enhanced tubes.
Table 2 summarizes the annual average values of the performance parameters derived from Table 1 for the different seasons.
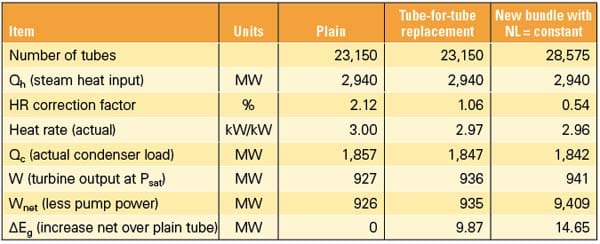
Table 2. Annual average plant performance improvement for NW-16 tubes. Source: Dr. Ralph L. Webb
Economic Evaluation
The greatest economic benefit to the plant will occur if the entire tube bundle is replaced using the same total lineal tubing length as is used in the plain tube design (Table 2). However, the enhanced tube bundle will have about 25% more tubes and will provide the same condenser water flow rate as the plain tube design. The full potential of enhanced tubes can only be obtained with a new condenser bundle design. A tube-for-tube replacement results in reduced water flow rate, which diminishes the performance potential.
This evaluation assumes that the only cost affected is the cost of the tube bundle; the cost of the condenser shell is not included in the analysis. The capital benefits of the enhanced tube condenser are described by a simple payback analysis. This analysis calculates the simple payback based on:
-
The capital value of the increased generation rate, assuming a value of $2,000/kW (= 2 × 10⁶ × ΔE).
-
The increased tube cost of the enhanced tube design, relative to the plain tube design given by
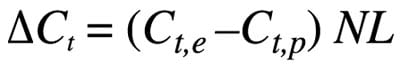
Table 3 shows the results of the payback analysis. Line 1 shows the increased generation capacity for the enhanced bundle design. The second line shows the capital value of the increased generation capacity (Ccap). Line 3 shows the total tube cost of the plain and enhanced tube bundles (Ct). The cost of plain and enhanced titanium tubes was based on data provided by Plymouth Tube, a manufacturer of titanium tubes. The present analysis is for 28.6-mm OD, 0.7-mm wall titanium tubes. It was also assumed that two-thirds of the tube cost is material and one-third is fabrication. The material costs were then adjusted by multiplying by the diameter ratio (28.6/25.4).
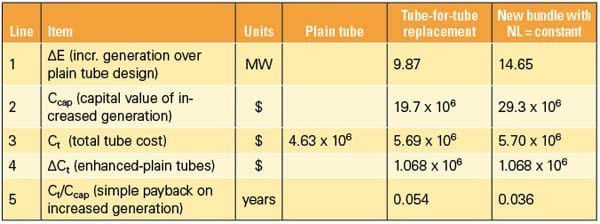
Table 3. Summary of economic benefits of the NW-16 tube condenser. Source: Dr. Ralph L. Webb
Table 3 shows that the material content cost is $10.35/m (or $36.85/kg) at the time this analysis was completed in late 2009. The plain tube fabrication cost was assumed to remain constant. It is conservatively assumed that the fabrication cost of the enhanced tubes is 75% greater than for the plain tubes. This resulted in tube costs of $14.93/m and $18.37/m for the plain and enhanced tubes, respectively.
Using the values given above, the tube bundle cost increment for the enhanced condenser tubes, relative to plain tube design (ΔCt), is
![]()
This value is shown on Line 4 of Table 3.
The simple payback on the increased generation cost for the tube-for-tube replacement is 0.036 years and 0.024 years for the "new bundle" — or just a matter of weeks (line 5). Note that the ΔE value in Table 3 is the net increase in turbine generator power over the plain tube design with the condenser water pumping power charged to the plain tube condenser. This is because the enhanced tube condenser has the same condenser water pumping power as the plain tube design. A tube-for-tube replacement will provide only 67% of the economic benefits (Ccap) of the entire tube bundle replacement.
Korodense Tube Bundle
A similar analysis was also performed for the Wolverine Korodense tube (Figure 2a). It is interesting to compare the performance and economics of the Korodense tube condenser with that of the NW-16 tube condenser. Comparison with the NW-16 tube condenser is done for the same number of tubes (28,575) and tube length shown for the "new bundle" with Ne Le = constant, as shown in Tables 2 and 3. The Korodense tube has 20% and 40% higher tube side heat transfer coefficient and friction, respectively, than the NW-16 tube (at the same Reynolds number). However, the steam side enhancement is 25% smaller than provided by the NW-16 tube.
The analysis shows that the Korodense tube results in a lower water flow rate for the same pumping power as the NW-16 and plain tubes. This flow rate reduction reduces the thermal performance. For a Korodense tube condenser with 28,575 tubes, the water flow rate is reduced 8%, relative to the NW-16 and plain tube condensers. The annual average value of ΔE is 24% below that of the NW-16 tube condenser, and the simple payback is 0.048 years. For the tube-for-tube replacement case, the annual average value of ΔE is 53% below that of the NW-16 tube condenser, and the simple payback is 0.12 years.
Not included in the economic analysis is the cost of plant replacement power during an outage that may extend longer than the outage time required to merely replace plain tubes. However, with the simple payback on the investment measured in weeks, the economics of using enhanced tubes remains exceedingly strong. Seriously interested condenser designers will likely use their own economic analysis to determine the benefits of using enhanced condenser tubes.
——Dr. Ralph L. Webb (ralph.webb@psu.edu) is professor emeritus in the Department of Mechanical and Nuclear Engineering at Penn State University. Webb is also the editor-in-chief of the Journal of Enhanced Heat Transfer.