
Why did the Environmental Protection Agency (EPA) drop the Cone of Silence around the good news about the continuing trend of improved air quality? The agency’s annual report of air quality trends was released in mid-March with barely a whisper. Even the major media outlets failed to report on the excellent results.
It’s common practice for agency heads to tout their accomplishments, earned or not, so I was quite surprised to read that EPA Administrator Lisa Jackson squandered a great photo-op by failing to highlight some good news about air quality regulation for a change. The EPA’s March 10 press release noted that the U.S. was making “progress toward clearer air” and “national trends show improvements.” That’s a good start, yet the headline is an understatement. I suspect that the news was quietly released because the report covered data collected through 2008, and covered a period of time prior to the current administration. Nevertheless, it’s good news for the nation as a whole, as all the statistical trends continue to point in the right direction (Figure 1).
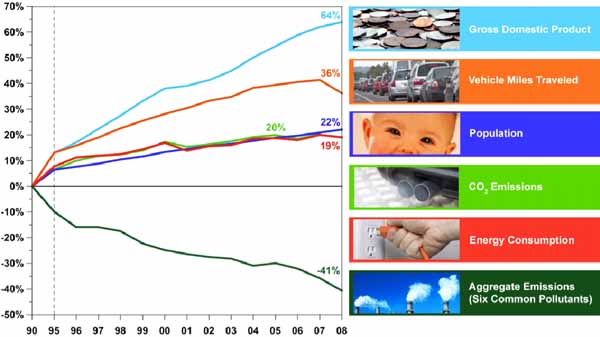
1. National ambient air quality trends since 1990. Source: U.S. Department of Energy
One interesting trend is the dramatic drop in the number of miles driven. Although not shown on the EPA graphic, the number of vehicles on the road continues to grow, and they are staying on the road longer. The number of vehicles in the U.S. has steadily increased by an average of 3.69 million a year since 1960. Today there are more than 250 million vehicles of all types on U.S. roads, which explains why the daily commute gets more tedious each year. I also found it interesting that the age of vehicles is increasing. The mean age of vehicles on the road in 1990 was 6.5 years; in 2007 it was 9.2 years. It seems we continue to buy cars at a rate faster than our population is growing, are keeping them longer, and are driving them more. Only until the recession kicked in and gas prices rose did the number of miles traveled drop.
The one statistic steadily on the decline is the aggregate emissions of what the EPA terms the “six common pollutants.” These six pollutants are ground-level ozone, particle pollution (PM2.5 and PM10), lead, nitrogen dioxide (NO2), carbon monoxide (CO), and sulfur dioxide (SO2). All have trended downward since 1990. Eight-hour ozone is down by 14%, PM2.5 (since 2000) is down by 19%, PM10 is down by 31%, lead is down by 78%, NO2 is down 35%, 8-hour CO is down by 68%, and annual SO2 is down by 59%. Unlike CO2, each of these pollutants has been the subject of numerous epidemiological studies conducted over many years that link particular health effects to their presence in the environment (although the PM2.5 studies continue to be challenged). I’m happy to have less of each in the environment, as I’m sure you are also. Unfortunately, the EPA missed the moment by not celebrating these results with the public.
Long-Term Trends Positive
Lest some conclude that these significant reductions have occurred only since 1990, another graphic on the EPA website illustrates that these emissions reduction rates were even more dramatic in the first 20 years of data collection than since 1990 (Figure 2). For reference, 1970 was the year the original Clean Air Act became law. The Clean Air Act Amendments were passed in 1990.
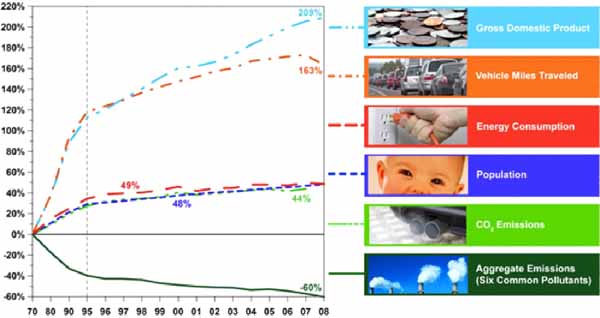
2. National ambient air quality trends since 1970. Source: U.S. Department of Energy
There are a few other important trends that are worth mentioning. In spite of the proliferation of plasma screen TVs (I plead guilty as I watch the opening day of the baseball season) and other home electricity hogs, the nation’s gross energy consumption continues lockstep with population increase. We’ll have to wait another year for the EPA data to determine if the economic doldrums we’ve been experiencing will make any abrupt change in these trends.
Two Observations
I have a couple of further observations about the latest EPA data. First, consider how few Americans can truly appreciate the long-term trends. The U.S. national median age is 36.7 years. That means that well over half of the people in the U.S. were born since the early 1970s, when the air was much, much worse. I remember that when I graduated from college in the mid-1970s, taking a job in Los Angeles was out of the question given the heavy smog–caused stinging eyes and burning throat. Next, those under 20 years of age make up 27.6% of the U.S. population. This group was born in an era of reasonably good air quality that many seem to take for granted. Finally, only 12.6% of our population is age 65 or older and can remember such environmental atrocities as Love Canal or choking smog in the Los Angeles basin that hid mountains for weeks on end. Will the next generation truly appreciate the amazing gains achieved over the past four decades?
Meanwhile, perhaps because fearful headlines seem to attract more attention than hopeful ones, the media continues to promote the idea that air quality is bad. For example, in November 2001, the Sierra Club reported in its study “Clearing the Air with Transit Spending” that “Smog is out of control in almost all of our major cities.” That headline came out shortly after the EPA reported two consecutive years with record lows for ozone and particulates. Another example: When the EPA proposed reducing allowable PM2.5 from 65 micrograms per cubic meter down to 35 (now final) that rule increased the number of metropolitan areas out of particulates compliance by two-thirds. The Atlanta Journal-Constitution reported on December 21, 2005, “EPA Barely Budges on Soot, Health Advice Disregarded,” a clear distortion of the facts. A final example: The years from 2003 to 2005 enjoyed record ozone lows, and the number of metropolitan areas out of compliance dropped from 43% to 18%. Predictably, a Clean Air Watch press release on November 10, 2005, proclaimed, “Smog Problems Nearly Double in 2005,” yet the article fails to mention that 2004 produced absurdly low levels of ozone and 2005 was much lower than previously years. My personal favorite is the Washington Post headline on April 29, 2004: “Ozone pollution has declined slightly over the past thirty years.”
An Internet search found that neither the New York Times, Los Angeles Times, nor the Washington Post reported on the latest EPA air trends report. In fact, a Google news search using the terms “EPA air trends annual report” failed to find a single major news report on the EPA report. I found that a little odd but certainly consistent with past practice.
Can’t Fool the Public
The good news is that the public isn’t buying what the media is selling. Recent Gallup Poll results found that the public is less worried about environmental problems than at anytime since the poll began (1989). In addition, the downward trend is startling. The poll results also showed a 25-point drop (from 63% to 38% from 1989 to 2010, respectively) in the public’s “worry” about air pollution in particular.
It appears the public is able to form conclusions about steadily improving air quality independent of the EPA. Collect your own data by just going outside, take a deep breath, and enjoy the view. That’s all the proof you need.
—Dr. Robert Peltier, PE is COAL POWER’s editor-in-chief.


