U.S. natural gas supply is expected to reach a record 117 billion cubic feet per day (Bcf/d) this summer, including 111.7 Bcf/d of dry gas production, but growing demand from liquefied natural gas (LNG) exports, data center load, industrial activity, and power generation is absorbing much of that growth, leaving less gas available for storage refill and a thinner cushion heading into next winter, according to the Natural Gas Supply Association (NGSA).
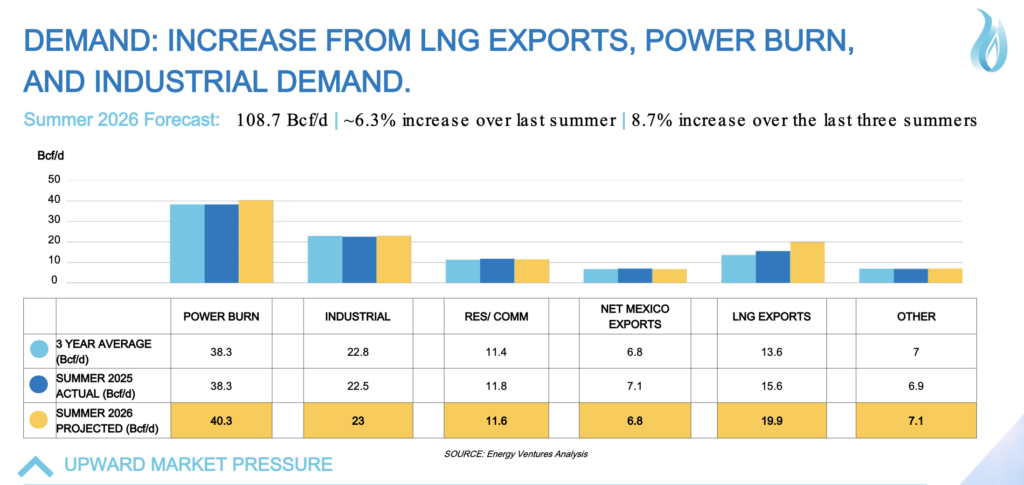
NGSA, the Washington, D.C.–based trade association representing natural gas producers and marketers, said in a summer outlook issued May 13 that total U.S. natural gas supply is forecast to rise 4.4 Bcf/d from last summer to 117 Bcf/d, while total demand is projected to surge 6.4 Bcf/d to 108.7 Bcf/d.
While LNG exports are expected to lead demand growth, rising 4.3 Bcf/d to 19.9 Bcf/d, power burn is forecast to increase 2.0 Bcf/d to 40.3 Bcf/d, remaining the largest U.S. gas demand sector, it projects.
NGSA suggests that the variables in supply-demand balance will exert broadly flat pressure on natural gas prices compared with last summer, though storage dynamics point to a tighter refill season. Henry Hub spot prices averaged about $2.70/MMBtu in April, below the roughly $3.10/MMBtu average in summer 2025, while the average summer 2026 futures price of $2.92/MMBtu suggests the market is already pricing in below-average storage builds and resilient demand.
U.S. natural gas storage, notably, is projected to end summer near 3,662 Bcf—a 10% year-over-year decline—as the refill pace materially slows compared to last summer. Total injections are forecast at 1,772 Bcf, compared with 2,210 Bcf last summer, while average daily injection rates are expected to fall to 8.28 Bcf/d from 9.91 Bcf/d. Despite starting the injection season above 2025 levels, NGSA projects end-of-summer inventories will sit roughly 106 Bcf below the five-year average heading into winter.
“Generally, we would say there’s upward pressure on price because of the storage dynamics this summer,” said Dawn Constantin, chairman of NGSA and COO of Gas & Power Trading Americas at bp, during a press briefing. “This summer, we’re coming out of the winter with a relatively healthy amount of gas in storage.” But with growing supply and growing demand, “there could be some competition between power burns, electricity demand—what is that summer outlook versus gas available to inject into storage? And that’s why you see the end-of-season number is a little bit lower than last year,” she explained. “Nothing to panic about, but the number is lower than last year.”
Natural Gas Power Burn Hits Record High
In its Summer Outlook, developed with Virginia-based energy consulting firm Energy Ventures Analysis (EVA), NGSA tracks production and demand, as well as storage behavior, weather risk, geopolitical tensions, and the capacity of pipelines and storage fields to move and absorb gas when and where it is needed.
On the supply side, the outlook highlights continued growth in dry gas from the Marcellus and Haynesville, rising associated gas from oilier basins like the Permian and Eagle Ford, and a shrinking inventory of drilled-but-uncompleted wells, all of which underpin a record supply of 117 Bcf/d but also sharpen the focus on regional bottlenecks and future capital needs. Marcellus production is expected to rise 1.71 Bcf/d, Haynesville 1.32 Bcf/d, and Permian associated gas 1.53 Bcf/d, while declining DUC inventories mean further growth may increasingly require new drilling rather than lower-cost well completions.
But on the demand side, the analysis underscores surging LNG exports, steadily rising power burn—driven by data center load and the need to firm growing solar and wind fleets—alongside expanding gas‑intensive industrial activity, all of which are tightening the balance even as overall prices are expected to remain broadly flat.
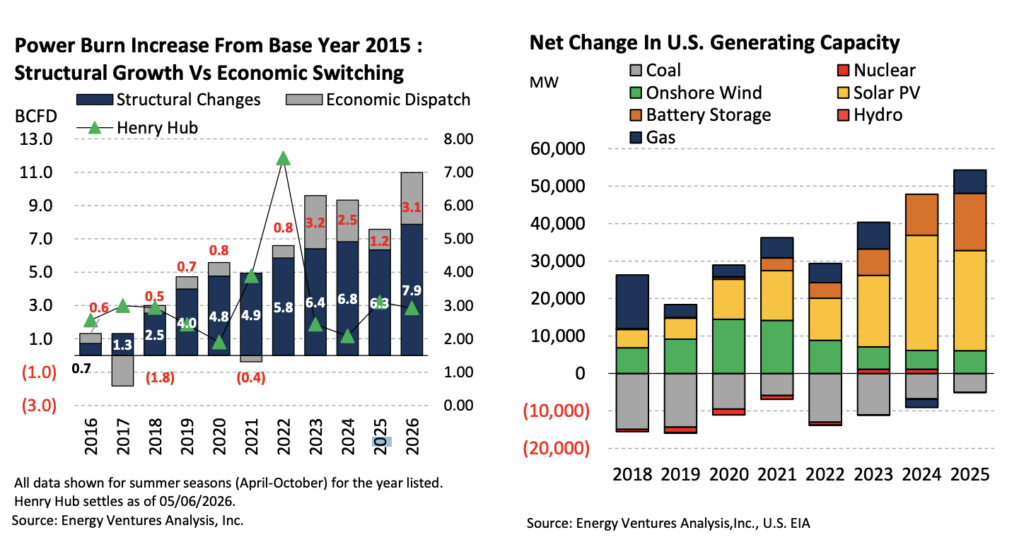
Power burn is forecast at 40.3 Bcf/d this summer, up 2.0 Bcf/d from Summer 2025, and is the largest single demand sector in the U.S. gas market. EVA separates the increase above its 2015 baseline into two components: structural growth and economic dispatch.
Structural growth, which reflects the deeper embedding of gas in the generation stack as coal retirements and rising baseload demand outpace renewable additions, accounts for 7.9 Bcf/d. Economic dispatch—the price-driven coal-to-gas switching that fluctuates with the gas-to-coal spread—is slated to add another 3.1 Bcf/d, rebounding from 1.2 Bcf/d in summer 2025 as moderating gas prices reopen switching economics. Combined, the two components could put summer power burn 11 Bcf/d above EVA’s 2015 baseline—the highest combined total in the forecast series, NGSA said.
For context, as the Energy Information Administration explains, natural gas-fired power plants convert roughly 45% of fuel energy into electricity. At that efficiency, 1 Bcf/d of natural gas sustains approximately 6,000 MW of continuous generating capacity. NGSA’s projected 6.4 Bcf/d year-over-year increase in total gas demand this summer is roughly equivalent to 38,000 MW of additional load, spread across export terminals, industrial facilities, and the power sector.
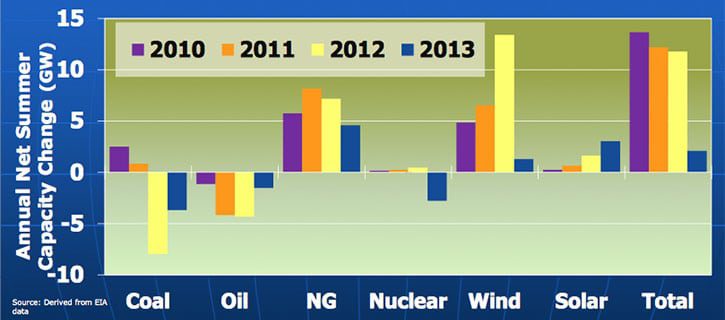
So far, the gas power sector has added more than 42 GW of net generating capacity since 2018, while cumulative coal retirements have surged to 80 GW, EVA said. While utility-scale solar photovoltaic additions remained the leading new capacity source in 2025, at 26.8 GW, the outlook notes that solar and wind do not dispatch on demand. “It’s great when the sun [is] shining and the wind is blowing, but you can’t call on those facilities, and that’s why you still see the need for more gas-fired generation,” Constantin said.
EVA, meanwhile, does not project a major coal resurgence, even after more than 80 GW of cumulative coal retirements since 2018 and despite the Trump administration’s executive push to slow additional retirements. But it notes that slower retirement timelines and rising gas prices could modestly boost gas-to-coal switching at the margin, which could temper gas-fired economic dispatch gains heading into summer 2026.
Data Centers Creating an ‘Upside’ for Thermal Generation
The most formidable accelerant of gas burn for structural growth—lasting generation demand—is data center load. U.S. cumulative data center capacity is projected to grow from 44 GW in 2025 to 55 GW in 2026—a 25% single-year increase—before reaching 74 GW by 2027, EVA said.
Virginia leads all states with 2 GW operating in 2025 and 6 GW planned by the end of 2027, while Texas follows with 1 GW operating and 6 GW planned, the fastest-growing market by incremental additions. PJM Interconnection, the grid operator serving 13 Mid-Atlantic and Midwestern states, and the Electric Reliability Council of Texas (ERCOT), which operates the Texas grid, account for the largest share of that incremental load. Ohio, Georgia, and Arizona are emerging as the next tier—each with 1–2 GW of planned capacity by 2027—a geographic spread that partly reflects grid saturation in primary markets and is extending gas generation requirements across PJM, MISO, and the Western Interconnection.
“A lot of these folks are looking for access to viable power—a place where potentially they could be close to gas supplies to meet their gas-fired generation,” Constantin noted. “Some of these data centers are building fit-for-purpose gas-fired generation. So being in a location where you have access to gas supply is really important.” EVA, for example, points to Oracle’s 1.2-GW Stargate campus in Texas, Meta’s 1-GW Prometheus facility in Ohio, which includes 0.2 GW of dedicated on-site gas generation, and Google’s $40 billion Texas commitment as projects that are “anchoring near-term buildout and directly adding to firm gas demand.”
But, as Constantin warned, the issue is inherently regional: “It’s not just one big supply pile in the middle of the country,” she said. “The regional dynamics, especially where we talk about demand, become really, really important to the infrastructure, storage.” Data center buildout could test transmission and interconnection timelines, as well as pipeline capacity, local gas deliverability, and storage access, in markets being asked to serve industrial-scale load growth, she said.
Federal policy, meanwhile, is being directly pitted against state-level resistance. EVA’s report points to President Trump’s July 2025 executive order streamlining federal permitting and opening Department of Energy sites for co-located AI and energy infrastructure as “a meaningful accelerant for development,” the firm says. On the state level, New York’s Senate Bill S9144 proposes a three-year permit moratorium, Virginia is shifting transmission costs to developers, and more than a dozen states have filed similar bills in 2026, it notes. Despite these state actions, the report projects “underlying demand pressure remains intact,” and will extend “reliance on gas-fired generation and strengthening the thermal outlook.”
LNG Exports, Industrial Demand Adding to Demand Dynamics
Finally, industrial demand is adding another layer to gas availability dynamics. EVA notes 63 industrial projects completed since 2017 have added nearly 1.99 Bcf/d of gas demand and $104.3 billion in capital investment. Another 20 projects expected between the second quarter of 2026 and 2030 could add roughly 1.98 Bcf/d of demand and $44.3 billion in investment, with about 76% of planned projects concentrated in Louisiana or Texas.
At the same time, LNG exports remain the largest source of demand growth in NGSA’s summer outlook. NGSA projects LNG exports will rise 4.3 Bcf/d from last summer to 19.9 Bcf/d as new liquefaction capacity comes online, including Plaquemines LNG, Corpus Christi Stage 3, and Golden Pass Train 1. EVA expects total U.S. LNG export capacity to exceed 19 Bcf/d by year-end 2026 and approach 26 Bcf/d by 2030.
However, EVA notes that U.S. LNG netbacks—the price an exporter effectively receives after accounting for delivery costs to the buyer—remain wide enough to support exports. Northwest Europe is in the $9/MMBtu to $12/MMBtu range, and Northeast Asia is in the $10/MMBtu to $14/MMBtu range. The firm also notes that China’s retaliatory tariffs are redirecting U.S. cargoes toward Europe and other markets as the EU phases in a ban on Russian gas, which appears to be strengthening the demand pull for U.S. LNG.
Constantin also said the current Middle East conflict, tariffs, and global gas displacement are among the variables that could shape summer balances. “The reality is there’s a lot of demand for U.S. LNG exports in the world, so there’s a lot of incentive to move gas to Europe, which is trying to wean itself off Russia,” she said. “Gas is also looking for supplies to mitigate what’s been lost through the Straits of Hormuz closure. So lots of incentives to build new plants, both from the 2022 conflict and also potentially from the current conflict. So this LNG export wedge is a really, really important driver of U.S. demand.”
Infrastructure Has Become the Constraint
For now, while the U.S. may have enough gas in aggregate, the bigger-picture concern is whether pipelines, storage fields, and regional delivery networks can move supply out of high-growth basins and into markets where power generation, data centers, LNG exports, and industrial loads are growing fastest.
Constantin pointed to the Waha natural gas pricing hub in West Texas, where Permian gas production has repeatedly strained takeaway capacity. “We could always use more pipe capacity coming out of Texas,” she said. “And in particular, if you’re paying attention to West Texas prices, Waha, there’s a lot of negative prices right now because there’s so much natural gas coming out of the Permian, and it’s difficult for the pipes to keep up.”
Storage is a parallel constraint, especially in New England, where limited underground storage leaves the region more dependent on above-ground LNG during cold-weather stress. Storage is a “really important driver. If you think of the Mid-Atlantic, [it] has some reservoirs, [it] has some kind of underground storage, but the New England area does not,” she noted. In regions without salt domes, aquifers, or other underground storage resources, she said, “storage for them probably looks like above-ground LNG,” adding that more storage is needed “particularly in these regions that get very cold in the winter.”
For NGSA, those pipeline and storage constraints put permitting reform at the center of the gas market’s longer-term reliability question. Between 2013 and 2024, natural gas demand grew 49% while pipeline capacity grew only 26% and storage capacity rose just 2% (measured 2013–2023), according to a December 2025 report from the National Petroleum Council (NPC) commissioned by the Department of Energy. In regions including New England, the Mid-Atlantic, and the Carolinas, multiple market-supported natural gas pipelines were delayed or canceled outright due to permitting challenges and litigation, contributing to price spikes and system strains during peak demand events. The most recent legislative vehicle on the issue—the SPEED Act, which passed the House on December 18, 2025, with support from 11 Democrats—would limit the scope of National Environmental Policy Act (NEPA) reviews for energy infrastructure and shorten the statute of limitations for legal challenges from roughly six years to 150 days.
In April, Sen. Tom Cotton (R-Ark.) introduced separate legislation that would establish FERC as the sole lead agency for interstate natural gas pipeline projects and consolidate judicial review of federal authorizations. FERC itself moved administratively in October 2025, publishing a final rule removing a 2020 regulatory provision—Order 871—that critics said had been used as a procedural stall tactic to delay pipeline construction during certain appeals. Meanwhile, Williams Companies’ Northeast Supply Enhancement Project—an approximately 37-mile Transco pipeline expansion designed to carry Marcellus gas through New Jersey and under Raritan Bay to New York City—received FERC reauthorization in August 2025 after years of permitting failure at the state level. After New York and New Jersey issued the remaining state permits in November 2025, Williams broke ground in April 2026.
“I am always an optimistic person, and I think this whole conversation about permitting reform is so interesting in that it is a bipartisan desire to do something on permitting reform,” said Dena Wiggins, president and CEO of NGSA, during the press briefing. “It’s my understanding from our outside lobbyists that the conversations are still going on, that people have not [stepped] away from the negotiating table, which I think [is] great.”
“I think that it is something that we absolutely have to get across the finish line,” Wiggins added. “We have abundant supply in this country. We just have to have the infrastructure—in our case, to move the molecules, but we need the infrastructure for all energy sources, because we all believe in the all-of-the-above approach to meeting the energy demand in this country.”
—Sonal C. Patel is senior editor at POWER magazine (@sonalcpatel, @POWERmagazine).