Reverse osmosis is a process familiar to most plant operators. Push makeup water through the right kind of membrane with sufficient pressure (osmotic pressure) and you generate a stream with few dissolved solids on the front side and a more-concentrated stream on the back side. The purified stream can be used to satisfy plant needs for high-quality water, and the other water can be discharged or passed through the membrane again. Desalinating saltwater to make potable water is among the most widespread applications of reverse osmosis.
Osmosis may be a less familiar process, but it’s equally important. In an osmotic process, water flows from a solution with a lower solute concentration (for example, fresh water) through a semipermeable membrane into a solution with a higher solute concentration (for example, saltwater) until the salt concentrations on both sides of the membrane equalize or until enough pressure builds on the high-concentration side to stop the flow (see box).
Researchers are now exploring whether the resulting osmotic pressure can be used to generate significant amounts of electric power.
An experiment in osmosis
A simple thought experiment can help you get your mental arms around the basics of osmosis. Fill a beaker with salt water, cover it with a semipermeable membrane, and submerge it in a beaker of pure water, making sure the water levels are the same (Figure 1). The semipermeable membrane is chosen such that water molecules can pass through it unimpeded, but salt molecules cannot. As more salt gets trapped in the membrane, fewer water molecules can pass through. Over time, the water level in the beaker will rise. The process is complete when the increase in head pressure in the beaker equals the osmotic pressure.
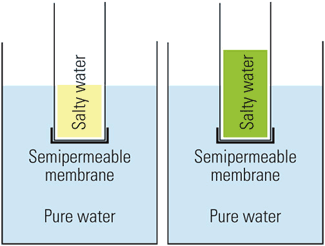
1. Learning by osmosis. A beaker filled with salt water and separated from pure water by a semipermeable membrane (L) will elevate the salt water level (R) as a function of the osmotic pressure. Source: POWER magazine
Have you ever wondered why drinking seawater will kill you? Fill your stomach with it, and osmotic pressure will draw pure water from your body in an attempt to dilute the salt water. One of two very bad things will happen next. Either you"ll become dehydrated enough to suffer seizures, unconsciousness, and brain damage, or your kidneys will fail from being overwhelmed with too many salt molecules.
Basic principles
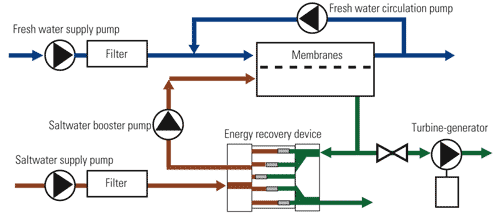
The basic osmotic power process (Figure 2) pumps saltwater against one side of semipermeable membranes whose other side is exposed to fresh water. The pressure at which the saltwater is applied to the membranes is ideally 60% to 85% of the osmotic pressure. Fresh water flows across the membranes, diluting the saltwater and increasing its flow rate. The resulting dilute saltwater (in green) is discharged through a hydraulic turbine. The dilution of the saltwater and the diffusion of salt into the fresh water reduce the concentration gradient at the membranes, a phenomenon known as concentration polarization.
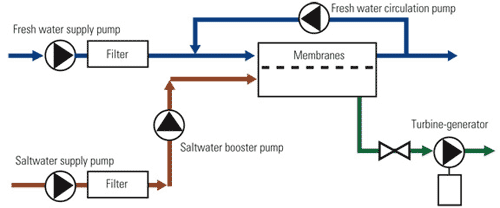
2. Back to basics. The basic osmotic power process. Source: Energy Recovery Inc.
Sufficient crossflow or agitation must be provided to minimize concentration polarization on both sides of the membranes, thereby maximizing the osmotic driving force. The net energy produced by the process is the amount produced by the turbine less the consumption by the pumps. Mounting one of the pumps on the turbine’s shaft can significantly reduce the system’s parasitic losses.
One way to reduce the amount of energy consumed by the saltwater booster pump in particular is to add an energy recovery device (ERD) to the circuit (Figure 3). The ERD increases the potential net osmotic power available by using some of the pressure in the high-pressure loop to dilute the saltwater with fresh water as it permeates the membranes. Saltwater is supplied to the ERD at low pressure. A portion of the brackish discharge from the membranes is also fed to the ERD. The ERD transfers the pressure of the dilute saltwater to the saltwater. The small pressure losses incurred in the membranes and in the ERD are made up by the saltwater booster pump.
3. No pressure. A high-efficiency osmotic power process can be designed to produce a net power output. Source: Energy Recovery Inc.
In addition to improving the performance of the osmotic power process, the ERD simplifies control of the saltwater hydraulics. The ERD seals the saltwater/dilute saltwater portion of the process so the only inlet flow is of permeate and the only significant outlet flow goes through the turbine. A small fraction of the dilute saltwater (0.5%) leaks through the seals of the ERD. Therefore, the turbine flow approximately equals the permeate flow. This relationship holds regardless of system pressure, saltwater flow rate, or dilution rate.
The membranes serve as the "power source" of an osmotic power process. The flux of permeate through the membranes and the resulting pressure on the saltwater side can be quantified in units of gallons per square foot of membrane area per day (gal/ft2/day) and pounds per square inch (psi), respectively. Increasing the water temperature increases the flux. Flux and pressure are related as follows: For a given membrane area, increasing the flux by increasing the flow to the turbine lowers the saltwater pressure.
Pilot testing concept
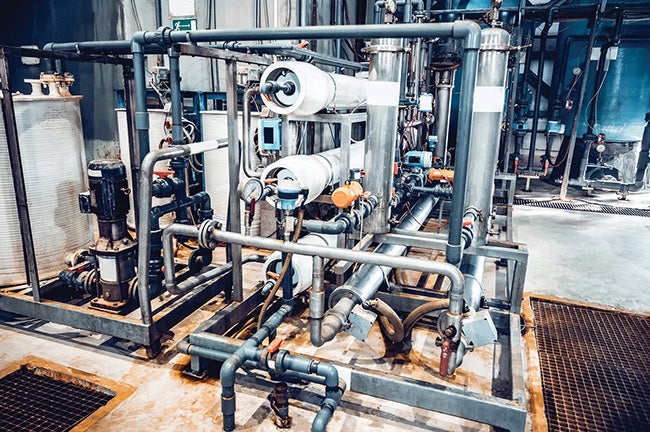
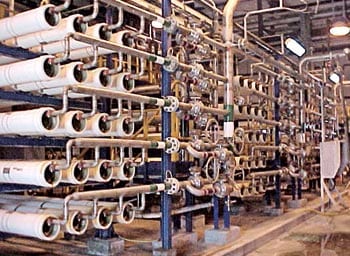
The authors" company—Energy Recovery Inc.—has demonstrated osmotic power generation using a reconfigured saltwater reverse osmosis (SWRO) process. The scheme was that shown in Figure 2, but with no freshwater circulation or turbine. Circulating fresh water was not possible because the tight permeate carrier-envelope construction of currently available SWRO membrane elements does not allow crossflow on the fresh water side. In lieu of a turbine, a portion of the dilute saltwater from the membranes was discharged through a throttle valve.
The two water sources used for the test were reverse osmosis permeate and Pacific Ocean saltwater. The saltwater had a total dissolved solids concentration of about 34,000 milligrams per liter ion at 57F and an estimated normalized osmotic pressure of 393 psi. Also used were 21 eight-inch-diameter spiral SWRO membranes (FilmTec SW30XLE-400i) from Dow FilmTec Corp. (www.dow.com) with a total nominal surface area of about 8,400 ft2. The SWRO process had a capacity of 66,000 gallons per day. Commercial pumps were used for saltwater supply, saltwater boost, and fresh water supply. Energy Recovery’s PX-70S Pressure Exchanger device served as the ERD shown in Figure 3.
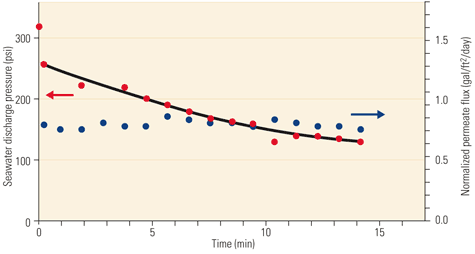
Figure 4 illustrates the system performance during one of the demonstration test runs, identified as "Test 4" in Table 1. When saltwater was exposed to fresh water across the membrane, the saltwater pressure rose to approximately 320 psi, or about 81% of the osmotic pressure. This pressure fell to about 260 psi (81% of the initial static pressure or 66% of the osmotic pressure) when the discharge valve was opened. The valve was adjusted to maintain a steady permeate flow rate of about 9 gpm, corresponding to a normalized membrane flux of 1.7 gallons per square foot of membrane area per day (gal/ft2/day). Saltwater was delivered by the booster pump at 58 gpm. The ratio of permeate flow to membrane feed flow (the dilution rate) was 13%. The saltwater pressure fell with time until the test was stopped after 10 minutes.
5. More pilot tests. Osmotic power demonstration Test 5 results. Source: Energy Recovery Inc.
Figure 6 compares the membrane performance during both test runs. In Test 4, the membrane power density began at about 1.8 x 10⁻⁴ horsepower per square foot (hp/ft2), or 1.5 watts per square meter (W/m2), and decayed by half in about 5 minutes. In Test 5, the membrane-specific energy began at 0.8 x 10⁻⁴ hp/ft2, or 0.65 W/m2, and decayed by half in less than 15 minutes.

6. Pushing the membrane. Membrane-specific energy performance is a key design parameter. Source: Energy Recovery Inc.
Initial system performance data are presented in Tables 1 and 2. In both tests, the system generated hydraulic power, but at a net loss after accounting for the pumps" energy consumption.

Table 2. System performance data from Test 5. Source: Energy Recovery Inc.
First results
This demonstration of osmotic power production successfully exploited the osmotic pressure between saltwater and fresh water to produce a pressurized stream of diluted saltwater that could be used to drive a turbine. However, the tests consumed more power than they created, indicating losses or inefficiencies in the process. Specifically, three types of losses are evident:
- The difference between the initial pressure and the osmotic pressure of the saltwater.
- The pressure drop through the membrane.
- The decay in operating pressure over time.
When the saltwater was initially exposed to fresh water across the membrane, the saltwater pressure increased as osmotic flow occurred. However, before the saltwater booster pump was started, there was no circulation or agitation of the saltwater, so dilute saltwater near the membrane reduced the osmotic pressure across it. This reduction is seen as the difference between the osmotic pressure of the saltwater (about 415 psi) and the initial static pressure of the saltwater (320 psi in both tests). Once the booster pump was started and the discharge valve was opened, the crossflow of saltwater across the high-pressure side of the membrane elements reduced the accumulation of dilute saltwater in the vicinity of the membrane surface.
The sharp reduction in saltwater pressure after the discharge valve was opened is evidence of frictional losses associated with permeate flow. The difference in permeate rates was insufficient to be detected as differences in frictional losses between the two demonstration tests. Higher permeate frictional losses would be expected at higher flux rates.
The decay in operating pressure with time (Figures 3 and 4) indicates that osmotic pressure fell as salts diffused through the membrane to the fresh water side. Any increase in salinity near the membrane surface would accumulate and reduce the osmotic pressure due to lack of circulation or agitation of the fresh water. This effect would be minimized by a properly designed osmotic power membrane, which would allow crossflow on both sides.
Realistic expectations
What level of performance could be expected of a mature osmotic power system? Based on the results of the demonstration tests, it is feasible that osmotic power membranes could provide a constant stream of pressurized water sufficient to drive a turbine—if sufficient crossflow were supplied to achieve turbulent conditions near the membrane surface and to minimize concentration polarization effects. With such an optimized osmotic power membrane, the potential osmotic pressure across such membranes would be the average of the osmotic pressure of the saltwater minus the pressure that was lost to flow friction and other energy sinks.
For the sake of this discussion, it is assumed that permeation and other membrane losses would be less than 25% of the average osmotic pressure. A large-scale osmotic power process would utilize high-capacity, high-efficiency components. Pumps and turbines of up to 90% efficiency are currently available, and the best motors and generators operate at up to 95% efficiency. ERDs that operate at up to 95% efficiency are also currently available. These projected membrane performance characteristics, pumps, turbines, and ERD efficiencies were used to extrapolate the overall efficiency of a hypothetical high-efficiency osmotic power process as a function of dilution rate (Figure 7).
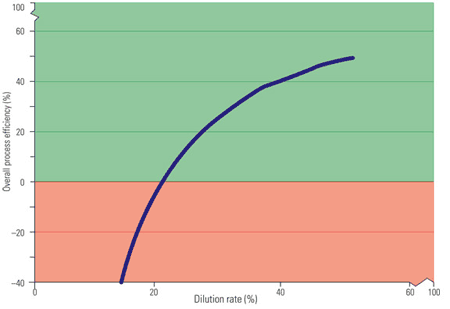
7. Making net power. Overall process efficiency depends on the dilution rate. Source: Energy Recovery Inc.
Figure 6 shows that at low dilution rates, the energy consumed by the pumps exceeds that produced by the turbine, as indicated by a negative efficiency. At higher dilution rates, the osmotic driving force is reduced, as indicated by the flattening of the curve. In addition, membrane performance limits dilution rate.
Although a sustainable dilution rate for osmotic power membranes is unknown, a 45% dilution rate is assumed in the following analysis, based on a typical recovery rate for SWRO. Assuming a turbine flow rate of 367 gpm, water salinity of 37,000 ppm, and the membrane, pump, turbine, and ERD performance characteristics listed above, an osmotic power system will indeed produce positive net power (Table 3).
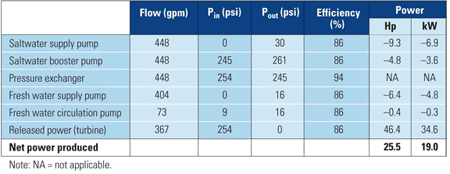
Table 3. Projected high-efficiency osmotic power system performance (base case: fresh water/seawater). Source: Energy Recovery Inc.
If the membranes perform at the highest specific energy recorded in the demonstration tests, more than 308,000 ft2 would be required to generate the net power shown in Table 3. If membrane-specific energy could be increased to 6 x 10⁻⁴ hp/ft2, for example, the required membrane surface area could be reduced to 94,000 ft2.
The cost to produce osmotic power depends in large part upon the cost of the membranes, which is unknown, and the salinity of the saltwater used. However, for a rough estimate we can assume that a full-scale osmotic power plant would cost about as much as a comparably sized brackish water reverse osmosis plant. Further assuming a membrane power density of 6 x 10⁻⁴ hp/ft2 (5 W/m2), high device efficiencies, and a 20-year plant life, osmotic power production costs could be between 20¢ and 50¢/kWh, making it comparable to other renewable power technologies such as solar and wind. Depending on the final osmotic power membrane configuration, topography, and other site-specific features, it is possible that the power requirements of an osmotic power facility could be significantly reduced.
The authors wish to acknowledge Theodore Kuepper and Randolph Truby of Energy Recovery Inc. for setting up and conducting the demonstration tests, and the Affordable Desalination Collaboration and the Naval Seawater Desalination Test Facility for providing access to the SWRO process equipment.
—Richard L. Stover, PhD is the chief technology officer of Energy Recovery Inc. (www.energy-recovery.com). He can be reached at 510-483-7370 or stover@energy-recovery.com). G.G. Pique is president and CEO of Energy Recovery Inc.; he can be reached at pique@energy-recovery.com.