Though “social costs” may be a new term of art in the power industry, it is about to become a critical one. Here’s what you need to understand about the concept in general and how it applies to the recently finalized cooling water intake rule.
The U.S. Environmental Protection Agency’s (EPA’s) recently released rule regarding Section 316(b) of the Clean Water Act requires that state permitting directors make site-specific determinations regarding fish protection for cooling water intake structures. (For an overview of the implications of the new rule and determining what constitutes best technology available, see “Site-Specific Factors Are Critical for Compliance with Final 316(b) Existing Facilities Rule” in the June 2014 issue.) Written explanations must accompany these determinations. The determinations must consider social benefits and social costs of various approaches to reduce the amount of fish eggs and larvae that are entrained in power plant cooling systems.
The requirement to assess and compare social costs and benefits in site-level permitting decisions is novel, and its inclusion in the 316(b) rule argues that permit writers and permittees should develop a deeper understanding of social costs generally and specific to entrainment remedies such as closed-cycle cooling and screening technologies.
This article provides some preliminary perspective on a topic that will undoubtedly be more thoroughly studied in coming years. We focus on the social cost of cooling towers because the types of social costs caused by screening technologies are also caused by cooling towers, and cooling towers have additional social costs.
What Are Social Costs?
“EPA Guidelines for Preparing Economic Analysis” (EPA 2010) defines social cost as “the value lost to society of all the goods and services that will not be produced and consumed if firms comply with the regulation.”
Considering what won’t be consumed, entrainment reduction technologies are expensive, costing sometimes hundreds of millions of dollars. These expenditures ultimately fall on customers and stockholders who would forgo consumption in response.
Conversely, the installation of entrainment reduction technologies requires manufacturing and construction. This generates economic activity, which supports consumption of goods and services.
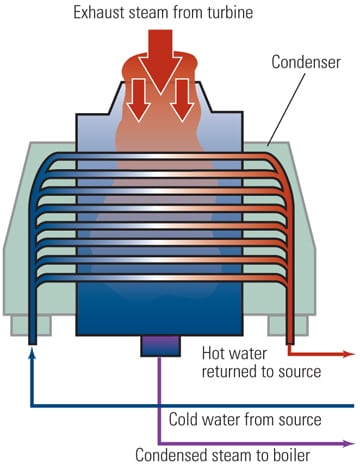
Other affected services are environmental- and health-related. Whether operated or not, natural draft towers can dominate viewsheds. Unlike screening technologies, the operation of cooling towers results in a large reduction in thermal flow. In removing this manmade effect, cooling towers also eliminate warm water outfalls that can attract gamefish, function as wildlife refuges, and support year-round angling in cold climates.
When operated, cooling towers are noisy. They also consume water and create plumes that precipitate particulate matter and can affect views. Moreover, fine mesh traveling screens and cooling towers both require power to operate. Cooling towers are particularly power intensive, and because of this, their operation can increase stack emissions, leading to environmental and health effects.
The myriad site-varying effects accompanying cooling towers, combined with the broadness of the social cost measurement mandate, can make identifying the social costs of 316(b) compliance options appear daunting. Here we hope to make the topic more accessible using the concepts of economic externalities and equilibriums.
Economic Externalities and Equilibriums
Economic externalities are benefits or costs affecting a party that did not choose to incur them. R. Coase’s influential 1960 Journal of Law and Economics paper “The Problem of Social Costs” clarifies that the benefit/cost distinction is one of perspective. Coase’s problem of social costs arises when production activities create negative externalities. By comparison, social benefits arise when production activities create positive externalities.
The social cost requirements in the new 316(b) rule apply to existing facilities with once-through cooling. From this perspective, regulatory baseline conditions include the entrainment, thermal flow, and unit performance implications of once-through cooling. This perspective is why fishing improvements from entrainment reductions are commonly expressed as a positive externality (that is, social benefit) of cooling towers rather than a social cost of once-through cooling. From this viewpoint, the loss of outfall fishing opportunities and wildlife refuges is a negative externality. Additional negative externalities arise from the installation and operation of cooling towers, including viewshed impacts from tower and plume, as well as the effects of additional water and fuel consumption. Social costing of cooling towers requires identifying and valuing these negative externalities.
The EPA describes social costs as monetized versions of opportunity costs. Opportunity costs represent forgone opportunities and are most reliably measured at economic equilibriums. The EPA Guidelines describe the partial and general equilibrium modeling paradigms for identifying opportunity costs. Partial and general equilibrium models consist of equations and data that represent components of an economy; they simulate economic decision-making to allow measuring opportunity costs across outcomes. Without delving into the inner workings of these approaches, their conceptual foundations can be used to explain the important role of equilibrium in identifying opportunity costs.
Implications of Compliance via Plant Closure
To begin, we’ll consider a facility valued at $100 million and facing a $300 million closed-cycle cooling conversion. In this case, rather than incurring the $300 million expense, the facility owner would close the unit. This means that at the post-closure equilibrium, the opportunity cost arises from the loss of the facility rather than the cost of the closed-cycle cooling conversion. Instead of increased economic activity from cooling tower expenditures, jobs and tax revenue are lost with the closure.
Because a cooling tower isn’t installed and operated, the negative noise, viewshed, water and fuel consumption effects associated with installing and operating cooling towers are not experienced. However, at the equilibrium the plant is shut down, which means that entrainment is eliminated and environmental services related to thermal flow are lost.
When units that provide system reliability services are closed, expenditures on compensating measures, such as transmission system enhancements are required. Also, if the closed unit is a fossil unit, a source of stack emissions is eliminated.
As generating capacity is lost with the closure, other units make up the lost generation and there is a new equilibrium in the affected electricity market. This process is depicted in Figures 1 and 2 using the baseline and with-regulation structure recommended in EPA (1991) “Guidelines for Conducting Regulatory Impact Analysis.” Each bar represents a generating unit. Capacity is represented by width and cost by height. To depict merit-order (least cost) dispatch, the units are sorted by cost with the least expensive units to the left.
The green line represents electricity demand or load. Units that are operating when demand is at this level are shaded and the total cost of meeting load is the sum of these shaded areas. As load increases, the green curve moves to the right, and as load decreases, the curve moves to the left, causing plant output and system production costs to fluctuate. As Figure 1 illustrates, in this time period, all units that can produce electricity at costs of below about $47/MWh are operating. The capacity that will be removed from service produces electricity at below $47/MWh and would be operating in this time period under baseline conditions.
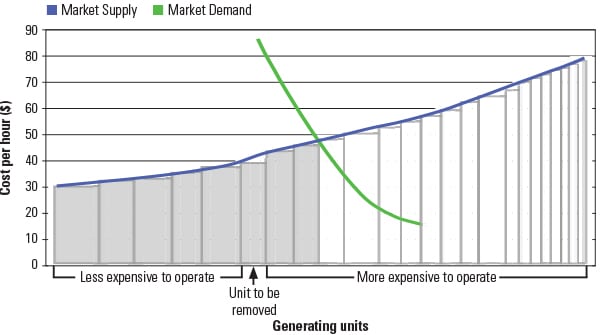 |
| 1. Electricity market under baseline conditions. The shaded bars represent units that are operating so as to meet load at minimum cost. Source: Veritas Economic Consulting LLC |
Figure 2 depicts re-dispatch to create a simulated “with-regulation” market by removing the unit and moving other units left to replace the capacity removed. Because these units are more expensive to operate, the cost curve shifts upward at all points to the right of the now removed unit.
As Figure 2 indicates, other generating units provide the electricity that would otherwise have been generated more cheaply. At the new equilibrium, a less-efficient unit is operating and the cost of meeting electrical load increases by the shaded area between the red and blue lines. The closed unit no longer has stack emissions, but there are increased emissions from the fossil-fueled plant(s) that make up the lost generation.
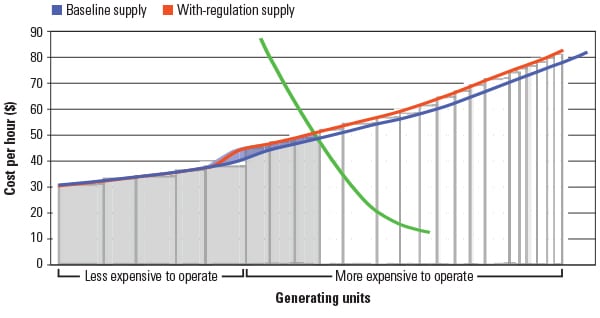 |
| 2. Electricity market under with-regulation conditions that reduce capacity. Lost capacity means different, more-expensive units operate, leading to generation cost increases (the difference between the red and blue lines) and changes in emissions. Source: Veritas Economic Consulting LLC |
Implications of Compliance via Cooling Tower Retrofit
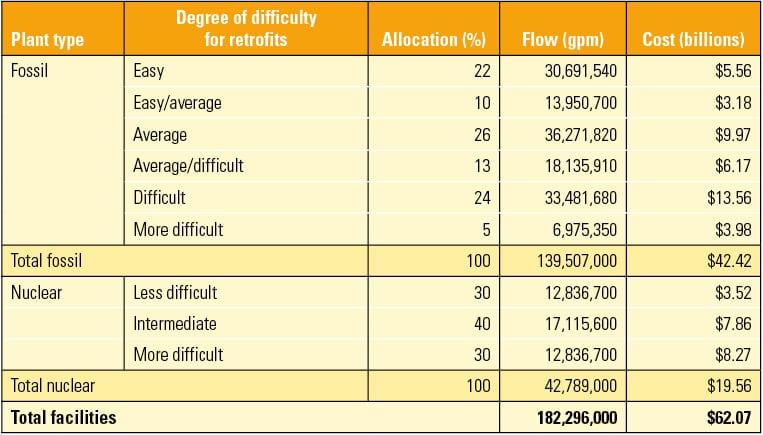
As just explained, increased production costs arise from capacity losses due to a plant closure. However, similar effects occur whenever a unit’s net capacity is reduced. This is the case any time a cooling tower is operated because of electricity requirements for pumps and fans.
Based on a “1% of capacity” rule of thumb for mechanical draft tower electricity requirement, a 1,000-MW unit converting to closed-cycle cooling would require 10 MW that would previously have been supplied to the grid.
Extended outages for conversions could have particularly significant production cost implications. Considering emissions impacts, outages like shutdowns lead to reduced on-site emissions for fossil-fueled units and increased emissions from fossil-fueled units making up lost generation.
These outages are expected to be more extensive for nuclear plants due to extensive underground piping and safety considerations. Unlike fossil plants, nuclear plants do not create stack emissions, and there is no on-site emission reduction. Operating pumps and fans are effectively an auxiliary electrical load requiring replacement generation from off-site fossil sources that do create emissions.
An additional important effect arises from cooling tower energy penalties. According to the EPA, the energy penalty arises from “slightly lower generating efficiency attributed to higher turbine backpressure when the condenser is not replaced with one optimized for closed cycle operation when retrofitting existing units.” When discussing this topic, the rule notes the EPA’s concerns regarding “increased air emissions associated with additional fuel usage due to the energy penalty when retrofitting to cooling towers related to human health, welfare, and global climate.” This effect occurs because many once-through power plants were situated and designed to take advantage of naturally cold water. Colder cooling water is important for thermal generation because it increases unit efficiency. Closed-cycle conversions would cause these units to use warmer closed-cycle cooling water and would reduce their efficiency.
This effect is specific to the atmospheric, water temperature, and operating characteristics of affected units. As Figure 3 illustrates, these efficiency impacts vary over the year. The red line represents efficiency reductions using once-through source water over the 8,760 hours in a year. The unit begins the year at maximum efficiency, becomes less efficient as water warms in the summer, and more efficient as it cools down in the fall and winter. The maximum efficiency loss that occurs around hour 5,000 is about 4%.
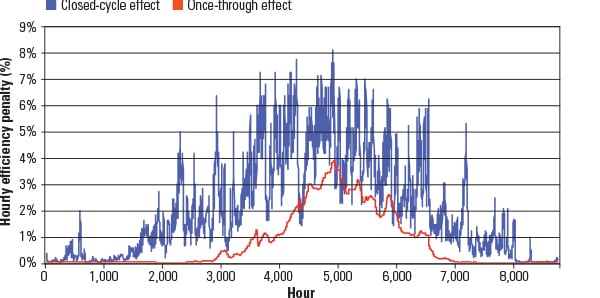 |
| 3. Hourly efficiency penalties from water temperature. Generating units often operate less efficiently with closed-cycle cooling, leading to increases in electricity production costs and emissions. Source: Veritas Economic Consulting LLC |
The blue line represents the impact from using closed-cycle cooling water. As the figure indicates, when using this warmer water, the unit is almost never at maximum efficiency. At the worst point, the unit loses about 8% of capacity. Whereas once-through efficiencies relate to source water temperatures, closed-cycle efficiencies are related to atmospheric heat and humidity (that is, wet bulb temperatures). This leads to the more variable hourly effect evident in blue.
In the context of system dispatch, this is important; high electrical loads often coincide with high wet bulb temperatures because hot humid air increases air conditioning load. As a result, this effect is at its worst when system generation efficiencies are low, leading to relatively high production cost increases in these hours.
The externality implications of the energy penalty effect depend on fuel type. Because nuclear plants operate on a fixed amount of fuel, efficiency reductions become losses in capacity and emission-free nuclear generation must be replaced with generation from marginal (load-following or peaking) thermal sources elsewhere on the grid. This leads to higher system-level fuel consumption, emissions, and costs. Conversely, fossil-fueled units typically can use more fuel. In this case, efficiency is reduced as described; however, capacity is not. Rather than system level changes, the efficiency effect translates into increased fuel consumption and air emissions at the site.
Many Unknowns
Observing externalities at economic equilibrium is helpful in identifying what social costs would occur with cooling tower retrofits. Ideally, these costs will be measured and quantified. Although no specific guidance is yet available, some of these costs have been studied.
For example, the Electric Power Research Institute (EPRI) Closed Cycle Cooling program has studied many of the issues described in this article. EPRI Report 1022760 (2011) quantifies a cooling tower’s site-specific environmental impacts and discusses and applies social cost–type values for many of these. EPRI Report 102275 (2011) and Report 1023100 (2011) describe national-level equilibrium-based assessments of increases in production costs, as well as shutdown likelihoods. EPRI Report 1023100 (2011) describes techniques for evaluating hourly energy penalty effects. EPRI Report 1023174 (2011) uses an avoided cost framework to identify the social costs of maintaining system reliability with unit closures.
Site-specific examples may also be useful. A 2009 article by this article’s authors applies similar avoided cost techniques to evaluate the social costs of maintaining reliability and also provides an evaluation of the economic impacts of facility closure.
Other potentially important effects are less well studied. For example, environmental economists commonly apply the hedonic valuation technique (this approach statistically decomposes the overall value of a property into the value of individual components) to evaluate the implications of negative externalities for property values. However, to our knowledge, the implications of viewshed-related property value effects that could arise with cooling tower retrofits have never been specifically studied. Likewise, no published studies have considered the economic value of outfall fisheries.
The two fishery-specific studies we located that have investigated this phenomenon are from the 1970s. Based on these studies, such sites are potentially valuable because of trips made by out-of-state anglers; winter angling pressure at one location was 3,500 anglers; at another location, there were 24,000 estimated trips. The prevalence of these winter fisheries is unknown; however, numerous sources indicate that winter fishing in warm water outfalls occurs for many different species and waterbody types.
The stack emissions and related social costs described in this article are a particularly important effect that has not been well studied. The rule notes that the EPA “has concluded that the proper forum to address such local impacts fully is in a site-specific setting.” An implication is that an improved understanding of the site-specific and system-level effects of stack emissions may be important.
Site-specific emission changes arise from effects described earlier in this article. Although no examples are yet available, changes in deposition of emissions could be identified with air impact modeling software. There is no report that describes a comprehensive system-level approach for assessing the social benefits and costs of cooling towers. However, the publically available EPRI Report 1019927 contains a multi-sector multi-cohort analytical framework for an application with very similar effects.
The (Challenging) Opportunity
Properly identifying and quantifying the social costs of entrainment reduction technologies will play an important role in complying with the new 316(b) rule. While the process will be challenging, the measurement of social costs in this context also brings opportunity. More so than ever before, issues that affect the electricity system and the environment require thoughtful determinations. The EPA’s novel social cost requirement provides a structured arena in which to study and evaluate the concerns of important constituency groups, including homeowners, anglers, and ratepayers, as well as energy efficiency and anti-pollution advocates. ■
— Matthew F. Bingham (Matthew.Bingham@VeritasEconomics.com) and Jason C. Kinnell are principal economists of Veritas Economic Consulting.