Every time a power plant is turned on and off, the gas turbine, heat recovery steam generator (HRSG), steam lines, steam turbines, and auxiliary components go through unavoidably large thermal and pressure stresses, which cause cumulative damage and incur future costs. The damage is compounded by fatigue and creep-fatigue interaction damage. These cycling-related costs and damages are attributable to current startup, shutdown, and rapid load following.
Combined cycle power plants have made rapid gains in market share and claimed a significant portion of the total generation portfolio over the past 10 or more years. With the recent market price trends for natural gas, they have become even more attractive for baseload and cycling generation. As major capital investments with strong earning potential, a focus on asset management is key to understanding and managing their total cost of operation and maintenance.
Many plants that were built in a competitive bidding market and designed for low initial costs and baseload operation are now being required to operate in load-following and on/off cycling modes. This change has created a need for quantifying true short- and long-term costs by determining the hidden costs of cycling damage and the losses associated with operating off the design point of a unit. An owner-operator or utility may find itself in financial distress by ignoring hidden or poorly understood costs of cycling damage as production costs spiral out of control.
This change in annual costs signals the end of what one might call the “honeymoon period.” To the uninformed, it may be an unexpected change from early life, reliable, low-cost cycling as the operating change results in cycling damage, and units begin to have failures as they reach fatigue stress limits. These may be surprise failures, since they are unseen in early plant life, and routine failures or forced outages increase costs dramatically. The original business model or pro forma is no longer valid as the costs increase and reliability decreases. The asset management mandate then is to prevent unexpected damage and understand the true cost of cycling for economic dispatch of the units in a competitive business model.
Whether cycling is required by the grid operator because of renewable integration or other factors, owners must be proactive about each manageable or variable part of the total asset and have:
- Personnel or training for understanding the impact of cycling operation.
- Procedures or updated operating processes and use of standardized “best practices operation.”
- Equipment upgrades for reliable, expected life when cycling.
All of these play a part in true asset management when cycling a unit or fleet of units so the transition to cycling operation goes smoothly at an expected cost with no surprises.
Costs of Cycling at Riverside Combined Cycle Units
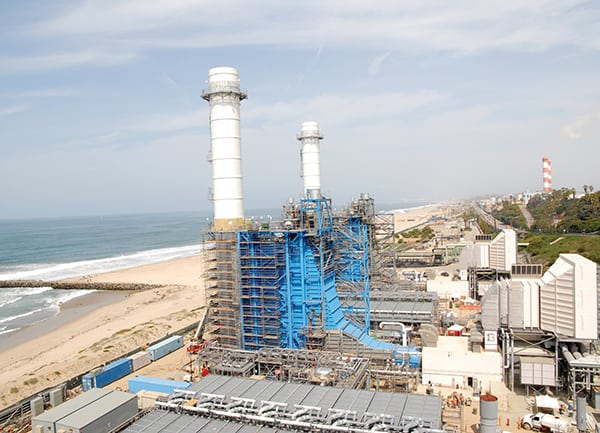
Xcel Energy and the Riverside Generating Station (Figure 1) have been experiencing market changes with the growth in renewable generation. This is requiring fossil fuel plants to balance the total demand with load following and cycling generation. As the amount of power generated from renewable energy sources like wind and solar becomes a larger part of the generation fleet, so does the impact of its intermittency.
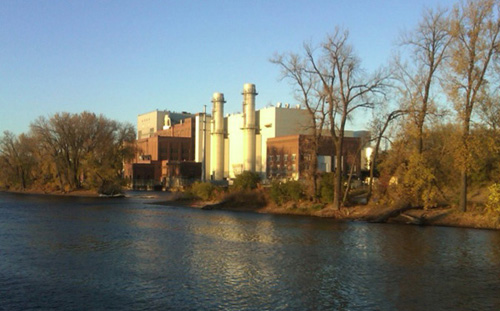
1. Xcel Energy, which owns and operates the Riverside combined cycle plant, must balance the output of substantial wind generation in its service area. Courtesy: Xcel Energy
With an understanding of this potential cost impact from cycling and rapid growth in renewable wind power, Xcel Energy undertook a cost-of-cycling study with Intertek AIM in 2010 at the Riverside plant’s combined cycle Units 7, 9, and 10. This was part of a fleetwide analysis of the cost of cycling for Xcel Energy and one of several combined cycle units being analyzed. Xcel chose Intertek AIM to do the study because of its extensive experience in calculating cycling costs for more than 400 plants in North America and Europe.
The initial study for cost of cycling was a two-part analysis of cost and operating data. The “top down” method uses a statistical analysis model of operating history and actual costs to identify a cost of cycling. The second, independent verification part is the “bottom-up” analysis. It requires a detailed review of work orders and cost. Both methods consider the damage rates found in the plant operating data. The independent methods allow for verification and provide validation of the best estimate of the historical cost of cycling, and the statistical model provides a method for future cost-of-cycling forecasts. After the initial study, a repeat analysis of the operating data confirms the improvements realized by the change or improvements identified. The process is repeated until the desired level of cost management or cost-justified improvements is realized. (Intertek also offers a real-time cost analysis system called COSTCOM to provide continuous and immediate cost impact analysis on each cycle for real-time management of costs.)
But how does a plant owner use the cost-of-cycling information? Figure 2 illustrates how it fits into the business model.
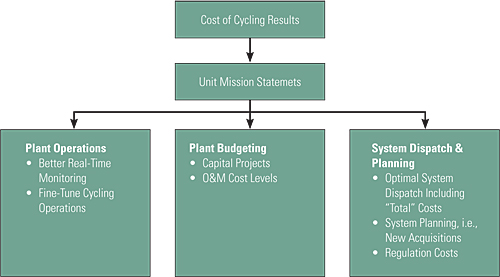
2. The costs of cycling impact a wide array of concerns. Courtesy: Intertek AIM
With the report in hand, the Riverside plant team went back to work. From the manageable options shown in Figure 2, they worked on the two variables that they had immediate control of. They provided training and revised the cycling procedures, including logic changes. The key to immediate improvements was not in new equipment but in how they ran the equipment when cycling the units.
The management team responded with a two-prong approach. First, they initiated immediate training for the plant team members, including all of the operating personnel, to help them understand the changing markets and their direct impact on the costs of cycling the units. Second, they reviewed the operating procedures that were identified as improvement opportunities in the details of the cycling analysis.
An additional part was to plan and budget for plant modifications that would improve the unit design for cycling. This step was delayed by the annual budgeting process and was not completed prior to this reporting of improvements in cycling cost. The modifications proposed in this third step included design changes and testing to validate the benefits realized as part of a management process for “plan/do/check/act.” The improvement validation is a result of budgeting for the repeated signature data analysis to show the gains made by simple steps of operating procedures and training, to show the impact of cycling costs.
Analysis of Cycling Improvements: Checking the Gains
With completion of the initial cost-of-cycling analysis in December 2010, the foundation was in place to make changes and measure the incremental improvements, starting with the low- or no-additional-cost modifications to the operating procedures. The recommended changes, which included procedures, logic changes to support the revised procedures, controls tuning, and additional operator training, were completed. Then Intertek AIM was hired to do a second set of data analysis in September 2011 to verify the improvements.
Along with some training for understanding of the impact, the operating procedures for cycling were considered for improvements, and a focus on best practices was reemphasized. This attention to the daily cycling operation showed a reduction of the damage rate indicators. This change resulted in managing the short- and long-term costs for this three-year-old plant by preventing damage and early life failures in critical components, including:
- Main steam to the turbine thermal ramp rates improved 46%.
- Preheater thermal ramp rates (previous failure area in the first year of operation) improved 39%.
- Auxiliary boiler steam to HRSG thermal ramp rate improved 90%.
- High-pressure superheater 2 outlet thermal ramp rates improved 37%.
- Twenty other data points showed an average improvement of 49%.
The signature data was collected for the critical components. The temperatures observed at the beginning and end of any moving minute period were used to calculate the temperature change for a moving minute period. A moving minute time period was used because Intertek AIM has found that thick-walled components, which are found in pressure vessels and piping, need at least a 15- to 30-minute period for a temperature change to cause high thermal stress in the component. These thermal ramp rates are based on multiple-minute moving windows.
The overall temperature range experienced by a component during the transient and thermal ramp rates are key indicators of cycling-related creep and fatigue damage. Intertek AIM used these parameters to quantify the relative severity of each unit’s load transients, as compared to a typical or average-severity transient for similar units that Intertek AIM has analyzed in the past, as well as standard industry practice and equipment manufacturer recommendations.
The significance of the recommended changes is demonstrated by the two data plots in Figure 3 and is quantified in the following repeated analysis. We wanted to know the value added of this analysis and see a return on the investment of the study costs.
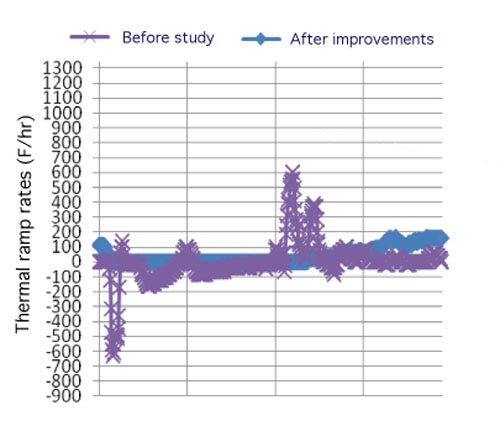
3. This graph shows the high-pressure superheater 2 outlet ramp rate for Unit 9 hot starts that occurred on July 16, 2010, and August 3, 2011—before (purple) and after (blue) improvements. Courtesy: Intertek AIM
In the initial study, we found damaging ramp rates of 900F/hr in the high-pressure superheater outlet temperature (purple trace). The blue trace shows the improvements in ramp rates after modifications, which were reduced by 33% to 600F/hr. The average improvement measured for the critical temperatures measured was 50%. Although there is still room for improvement to reduce the ramp rate in the high-pressure superheater, the change was made without any additional capital or maintenance costs.
Cost Benefit
Next we applied this amount of reduction as a simple percentage of the cost per cycle for the cost analyzed for each component that showed an improvement from our 2010 analysis. It resulted in a cost reduction per typical start of several thousand dollars. Realizing the benefit for each of the planned 10 starts per month means that in just three months, we can see a return of nearly $100,000, and the study costs were recovered without any additional expenditures of capital or maintenance dollars.
This also means that if the plant is operated without understanding the hidden costs, the operator could be undervaluing the true cost of cycling by $50,000 to $100,000 for each combined cycle unit startup or some $100,000 to $150,000 or more for a large coal station startup. The variability of equipment and operational procedures requires a unit-specific analysis to determine the true cost. The real potential payback from the study occurs as the customer applies the information, selects the most cost-effective countermeasures, and puts them to work as part of asset integrity management plan for cyclic operation.
Only then can the true long-term benefits of the study be realized as operating costs are recovered and managed by running the most cost-effective mix of units in the fleet and extending the units’ reliability and life. This is achieved by managing the cycling when necessary to be the least damaging while meeting the system needs for generation.
The results for Riverside show an average improvement of 48% in several key indicators that measure the damage accumulation rates from cycling. The speed of a payback is determined by management actions, but at Riverside it was less than six months. Furthermore, the improvement was achieved without equipment modifications, and more gains are possible and are planned.
—Douglas Hilleman, PE and Steven A. Lefton are senior project manager and consultant with Intertek AIM . Kenneth Beadell and Timothy L. Kiel, PE are plant director and engineering manager with Riverside Plant, Xcel Energy. This article is adapted from a presentation delivered at the 2013 ELECTRIC POWER Conference & Exhibition.