“Faith” is generally defined as the belief in things that are unseen. Using that definition, many utility-industry managers and leaders apparently consider customer satisfaction the ultimate faith-based initiative. They may be wrong.
Consider these heretical propositions:
- Customer satisfaction probably doesn’t generate new revenue for utilities (although utilities in restructured markets may find that it slows customer churn and reduces potential lost revenue and earnings).
- It is not clear that customer satisfaction lowers costs for utilities.
- If customer satisfaction does lower costs, how would those savings compare to the savings from asset sales or downsizing?
- Could the pursuit of customer satisfaction create new costs, at a time when cost-reduction is the industry’s mantra?
- Finally, how important are the perceptions of the utilities’ customers compared to what industry veterans see as the dominant realities of the utility business: operating cost per unit, new construction costs, reliability, and safety?
I’ve been analyzing utility customer satisfaction (CSAT) for several years, conducting dozens of lengthy interviews with managers, directors, and officers at electric and gas distribution utilities, both shareholder-owned and publicly owned, across North America. My goal has been to move beyond faith and try to determine, quantitatively as best I can, whether and to what degree utility customer satisfaction is related to business outcomes for utilities.
Shareholder Returns
Creating shareholder wealth is a critical measure of success for most businesses, so we’ll start there. Data compiled by L.E.K. Consulting and J.D. Power and Associates clearly shows that top-tier utility customer satisfaction does not correlate with (either as a result or a driver of) higher shareholder returns. Shareholder return is the sum of changes in the price of a stock, plus the payment of cash dividends. For this analysis, I chose annual shareholder returns over a 10-year period to minimize the potential for distortion from unusual, transient, or one-time events. The longer time frame smoothes out dramatic swings from one year to the next.
Table 1 is a list of the investor-owned electric utility holding companies that posted top-quartile average annual shareholder returns over a 10-year period through December 2007, as calculated by L.E.K. Consulting. That year was the last that L.E.K. performed its calculations.
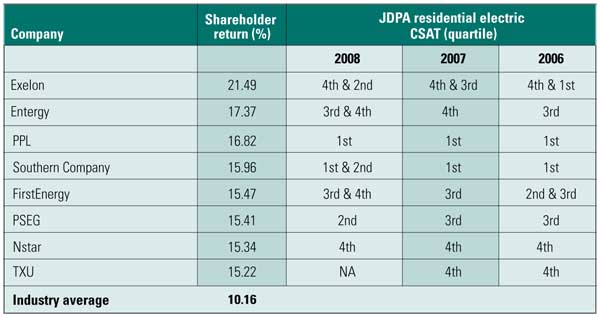
Table 1. Top quartile utility HoldCo shareholder returns don’t correlate with utility OpCo customer satisfaction. This table shows investor-owned electric utility holding companies with first-quartile average annual shareholder returns over a 10-year period ended December 31, 2007. The three columns to the right show the J.D. Power and Associates residential electric customer satisfaction scores for the operating utilities that are units of that utility holding company. Source: Data from L.E.K. Consulting and J.D. Power and Associates
These eight utility companies all had annual shareholder returns that were well above average for a prolonged period of time. The utility industry average annual shareholder return for this 10-year period was 10.16%. The last three columns show the performance of each firm’s operating utilities in the three years of the J.D. Power and Associates residential electric customer satisfaction surveys. Holding companies with multiple operating utilities (such as Exelon, Entergy, and FirstEnergy) show multiple J.D. Power quartile scores to reflect the different scores of those operating companies.
Only two utility holding companies—Southern Company and PPL—that achieved top-quartile annual shareholder returns over a 10-year period while their operating utilities also scored top-quartile customer satisfaction in recent the J.D. Power surveys. This pattern has persisted for several years. Three of Southern Company’s four operating companies achieved top-quartile CSAT scores in 2008 while the fourth unit was near the top of the second quartile.
The table shows more instances where top-quartile shareholder returns negatively correlated with customer satisfaction at the operating utility. Cases in point include Exelon (its Commonwealth Edison unit has been fourth quartile for some time), NSTAR, and TXU Energy. This relationship has persisted for several years.
Table 1 also shows a number of cases where holding companies with top-quartile average annual returns had either second- or third-quartile CSAT performance—which further muddies the customer-satisfaction waters. This broad distribution of results, which I’d call almost random, raises questions as to whether there is any hard and fast rule about the relationship of shareholder performance and customer satisfaction.
Table 2 is a list of utility holding companies that posted fourth-quartile average annual shareholder returns over a 10-year period through December 31, 2007, again drawing on calculations from L.E.K. Average annual returns for these companies were about as far below the industry average as the returns in Table 1 were above it. As with Table 1, the industry average annual return was 10.16%, and the last three columns show the performance of each firm’s operating utilities in the three years of the J.D. Power residential electric customer satisfaction surveys.
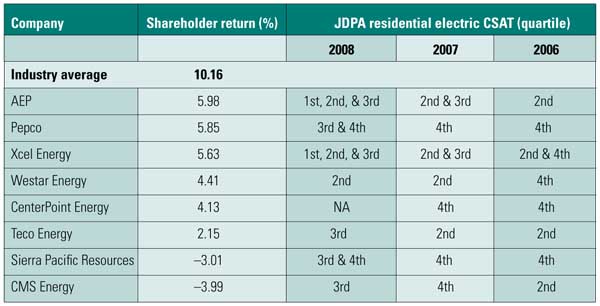
Table 2. Fourth-quartile utility HoldCo shareholder returns don’t correlated with utility OpCo customer satisfaction. This table shows investor-owned electric utility holding companies with fourth-quartile average annual shareholder returns over the 10-year period ended December 31, 2007. The three columns to the right show the J.D. Power and Associates residential electric customer satisfaction scores for the operating utilities that are units of that utility holding company. Sources: Data from L.E.K. Consulting and J.D. Power and Associates
Table 2 tells the same story, albeit from a different vantage point, as Table 1. There are several instances where holding company shareholder returns and operating company customer satisfaction tended to correlate positively. But there were also several instances where operating utilities received first-, second-, or third-quartile CSAT scores at a time when the holding company recorded fourth-quartile returns.
Tables 1 and 2 show TXU and CenterPoint Energy as “NA” for 2008 because J.D. Powers removed them from its national customer satisfaction survey last year. Both were placed in the narrower survey of the Texas market, because those utilities’ scores in the Texas survey can’t be compared to the national survey.
What’s Love Got to Do with It?
Although some of the specifics change from year to year, analyzing several years of data from J.D. Powers and L.E.K. confirm that there is no consistent correlation between shareholder returns for utility holding companies and the customer satisfaction performance of their electric operating companies.
The explanation may be simple: Top-performing utility companies tend to be larger and have a more aggressive business strategy compared to companies with fourth-quartile shareholder returns. Holding companies listed in Table 1 tend to have big, unregulated businesses—power marketing and merchant power generation—which appeal to investors looking for higher returns. The prospect (in many cases, the reality) of higher returns from less-regulated businesses may lead investors to bid up the shares of those companies. Investors are willing to shoulder greater risks if they can receive higher returns.
Regulatory Risks and Debt-Service Costs
Conventional industry wisdom holds that higher customer satisfaction lowers regulatory risks. That could translate into higher credit ratings and lowered interest costs on debt. In 2005, Todd Shipman, a utilities analyst at Standard & Poor’s (S&P), created a scatter-plot diagram showing that utilities with higher customer satisfaction tended to experience lower regulatory risks. Similarly, utilities with lower customer satisfaction tended to experience higher regulatory risk.
S&P said it would include utility customer satisfaction performance as one of several qualitative factors to assess the credit-worthiness of utilities. Shipman emphasized that a utility customer-satisfaction performance was a swing factor, not a significant driver, in setting credit ratings for utility borrowers. To date, S&P has made no changes to utility credit ratings because of a utility’s customer satisfaction score, Shipman says.
Regulatory Outcomes
As regulated entities, the business prospects of many electric utilities often rise and fall on decisions by state public utilities commissions (PUCs). The most important of these regulatory encounters are rate cases—of which there have been and will be many—and strategic transactions such as mergers and acquisitions. Among the most controversial and most significant regulatory actions are decisions on new or upgraded generating capacity.
Regulatory orders on returns on equity (ROE) and strategic transactions result from the blending of “objective” quantitative analytics with “subjective” qualitative judgments of the regulators and their staffs. Despite a regulatory commission’s heavy reliance on quantitative metrics, there is no way to remove the qualitative factors like “just and reasonable,” “used and useful,” and “fair” from the regulatory process.
What does the data tell us about any correlation between customer satisfaction and awarded ROEs? Very little.
Table 3 shows no consistent pattern linking the customer satisfaction of shareholder-owned electric utilities with those utilities’ authorized ROE. The customer satisfaction data comes from J.D. Power while the awarded ROE data comes from the Edison Electric Institute’s annual rate case summary for 2008. All the regulatory decisions in Table 3 came during the 2008 calendar year. Typically, a utility files its application about one year prior to the PUC decision.
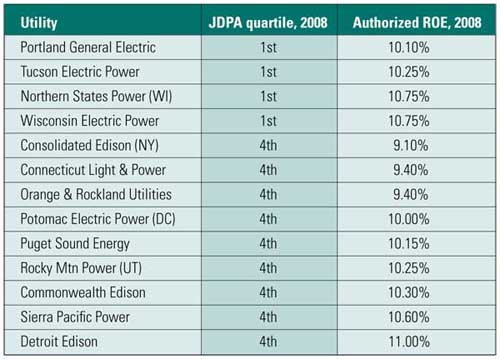
Table 3. No discernable pattern linking residential electric utility customer satisfaction and authorized ROE for utilities. There appears to be no clear or consistent relationship between residential electric customer satisfaction and authorized return on equity (ROE). This table combines investor-owned residential electric utility (IOU) customer satisfaction data from J.D. Power and Associates with data on authorized ROE for investor-owned electric utilities from Edison Electric Institute. There is a relatively narrow band of 75 basis points separating authorized ROEs for electric utilities with top-quartile customer satisfaction. But a far wider band of 190 basis points separated authorized ROE for electric IOUs with fourth-quartile customer satisfaction. Some utilities with fourth-quartile customer satisfaction performance actually had higher authorized ROE than utilities with first-quartile CSAT scores. Source: J.D. Power and Associates; EEI Annual Rate Case Summary, 2008
One manager for a utility with a long record of market research and top-tier customer satisfaction quantified benefits the following way: “Our state regulators have awarded us a higher rate of return, about 0.5%, equal to $5 million in incremental annual earnings, with higher customer satisfaction being the differentiator.”
As with Tables 1 and 2, the data in Table 3 raise as many questions as they answer. Why would several electric utilities with fourth-quartile customer satisfaction have meaningfully higher authorized returns than electric utilities with first- or second-quartile CSAT scores? In a world where a 25-basis-point difference (one-quarter of a percentage point) in ROE could mean $25 to $50 million a year in annual revenue, that is the proverbial $64 million question.
A Confused and Inconclusive CSAT World
Interviews with utility executives and managers about how their companies have benefited from high customer satisfaction, or been hurt by low customer satisfaction, yielded the following points:
- “If you want to get anything done at the PUC, you’d better have good, quality customer satisfaction”
- “It reduces friction with customers.”
- “It makes customers more willing to cut you some slack when you do mess up.”
- “It helps us run our business the way we want.”
- “It helps the commission look more favorably, and perhaps act more rapidly, on a strategic transaction.”
- “It improves employee morale.”
- “It helps us attract better-quality employees.”
- “We can recover in rates many of the improvements we implement.”
- “It reduces waste, lowers costs, and improves processes.”
- “It serves to confirm our decision making.”
- “It positions us more favorably with vendors.”
Two sharply different rationales from utility leaders and managers exist on the question of whether and to what degree their companies benefit from higher customer satisfaction. Utilities with a long track record of first-quartile customer satisfaction performance say they don’t pay a lot of attention to the various studies. They don’t do what they do to win awards. They see customer satisfaction as an outer expression of sound business practices and a sincere commitment to serve customers—an internal driver.
Comments from utilities with fourth-quartile scores have a harder, more skeptical edge: “What’s the return? Why should I make that investment?” or “We see it as something that’s nice to have, but not mission-critical. Besides, doesn’t it increase costs? We’re trying to reduce costs.”
The best summation comes from Grant Yoshihara, managing director at NW Natural, a natural gas utility headquartered in Portland, Ore. He said, “If you run your business in a way that dissatisfies your customers, you subject yourself to more risks. More things could go wrong, particularly in the regulatory arena. Eventually those things will catch up with you.”
—John Egan (johnegan1959@gmail.com, 720-949-4906) is founder and principal of Egan Energy Communications, which works with utilities to improve the impact and lower the cost of their stakeholder communications. He was a former research director at E Source, media relations supervisor at Salt River Project, and reporter at The Energy Daily.