Flue gas desulfurization (FGD) projects continue to be the largest line item for many utility construction budgets. The technology is sound, so the operational risks have decreased remarkably over the past decade. What remains, however, is the risk of project overruns caused primarily by rapidly rising commodity prices. In our 2007 survey (for which data were collected in 2006) we found that the base cost of an FGD system was $319/kW averaged over 49 separate projects. That was an increase of 21% since the previous survey was completed in 2005. Much has changed since that report was presented in the July 2007 issue of POWER.
Survey Background
The data for the current survey were collected during the period December 2007 through June 2008 and then presented to the Fossil Productivity Committee (FPC) at the EUCG fall meeting in late 2008 (see sidebar, "Inside the EUCG"). There are important differences between the two surveys. First, the number of utility participants remained the same, at an even dozen, although there were four new participants. The survey continues to cover an excellent cross-section of coal-fired utility plants involved in FGD retrofits (Figure 1).
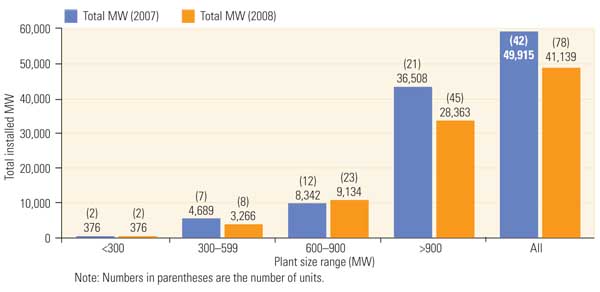
1. New survey update. The 2008 EUCG flue gas desulfurization (FGD) cost survey includes 78 units totaling 41 GW. Source: EUCG
Total project costs [for a flue gas desulfurization system] reported in the 2008 survey were approximately 28% higher than those reported in the 2007 survey.
The 2008 survey covered more than 41 GW and 78 scrubbed units and represents the largest FGD data set analyzed in the industry. The average unit size in this survey was 956 MW, down slightly from 1,019 MW in the 2007 survey.
The survey data reflect the wide variety of plants, locations, and fuels used in this industry. The survey also covered a nice range of FGD system start-up dates (Figure 2). Nearly 50% of forecasted in-service dates were 2009 and 2010, the average start-up date is 2010, and the latest is 2015. As the reported start-up dates are in the near future, we have high confidence in the final construction cost estimates, which reinforces the usefulness of the data. We have included results from the 2007 survey in the figures to illustrate recent industry cost trends for FGD systems.

2. Latest cost data. The majority of the survey data come from scrubbers that were recently installed or are currently under construction. Source: EUCG
System design characteristics and assumptions for units covered in the current survey were not unlike those in the 2007 survey and are summarized below:
-
All the surveyed facilities are using limestone forced oxidation technology.
-
Tower technology selection varies by site, although more than half of the units still prefer spray technology (Figure 3).
-
The FGD average sulfur dioxide removal design basis selected by respondents remained in the range of 4.0 to 4.9 lb/mmBtu, although the number of respondents reporting the mean value almost doubled (Figure 4).
-
Sixty percent of the respondents stated that their design includes a single stack/double flue configuration; another 29% specified a single stack/single flue design. These results are very similar to the 2007 survey data.
-
There was more agreement with the flue material selection. In 79% (70% in 2007) of surveyed plants the flue is fiberglass resin; 12% (14% in 2007) selected an alloy steel or C-276 clad flue.
-
For FGD waste disposal, 60% (53% in 2007) of respondents are using an old or new landfill; slightly fewer (26%) are recycling at a wallboard plant (35% in 2007).
-
Reagent prep delivery is mostly by truck (57%); the remainder use rail (24%) and marine vessel (17%). These results are within a few percentage points of the 2007 survey results.
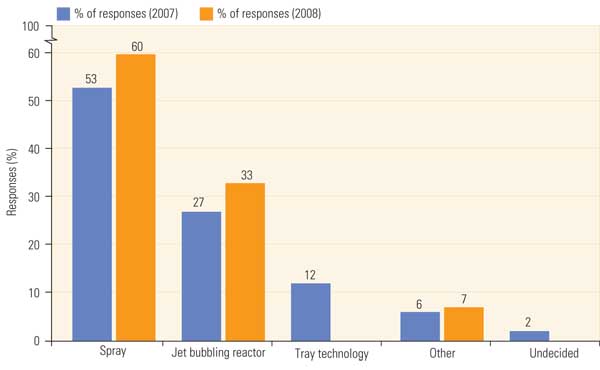
3. Make your choice. Although all of the FGD units reported on in the current survey were of the limestone forced oxidation technology, almost two-thirds were of the spray type, and a third were jet bubbling reactors. Source: EUCG
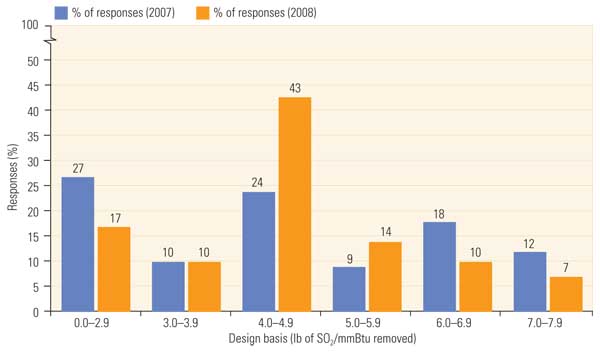
4. Capture the SO2. The average FGD SO2 removal design point is about 4.5 lb of SO2 removed per million Btu of fuel consumed. Source: EUCG
Cost Survey Results
Average total installed costs reported by the survey respondents were expected to have wide variation, principally because of the peculiarities that exist at each project site, the retrofit project complexity, and the timing differences between projects. Therefore, defining an average project cost is difficult without some understanding of the project-specific details of each of the 78 units surveyed. A look at the summary or "fully loaded" installed costs clearly shows that costs continue to rise (Figure 5) and continue to stay consistently above $300/kW. The data clearly show there are economies of scale for larger plants, but they are not as pronounced as you might expect.
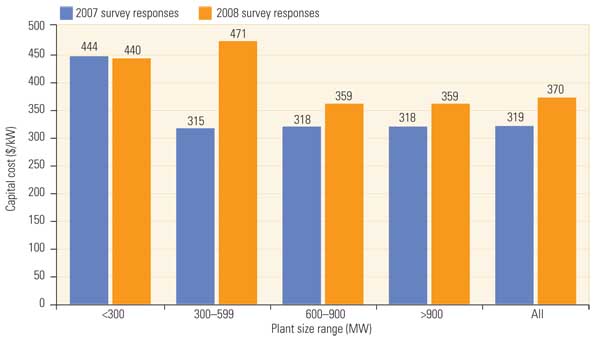
5. Big bucks. “Fully loaded” FGD system capital costs were reported by unit rating and show a significant increase since the previous survey. Source: EUCG
The survey data go into much more detail, although the in-depth data are restricted to those that participated in the survey. However, we can take one more step and strip out the FGD-only costs from the installed cost data to evaluate system-only cost changes since the 2007 survey.
The survey instructions requested that respondents define project costs for their just-completed, current, under construction, and/or planned FGD projects and that they include the following line items, at a minimum, so that comparable data were reported that could be compared across projects:
-
Project design costs
-
New stack and ductwork costs
-
Reagent prep method and costs
-
Absorber island/reactor technology costs
-
Site prep costs
-
Wastewater treatment costs
-
Balance-of-plant costs
-
Other direct costs (such as engineering and project management)
-
Associated boiler work (such as boiler modifications and draft fans)
Comparing these costs to the "FGD only" cost summary, we begin to see some of the economies of scale expected for projects of this size, although they are not as pronounced as might be expected (Figure 6). The FGD-only costs were calculated as the sum of the FGD absorber reactor costs, reagent preparation system costs, the FGD waste disposal system costs, and the balance-of-plant cost. Stacks, site preparation, wastewater systems, and other project costs for boiler cleaning systems, coal blending or major electrical upgrades are excluded. This definition was refined before the current survey in order to obtain better cost data for the different cost categories.
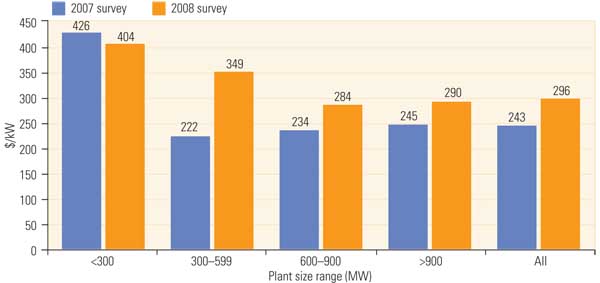
6. Costs have risen. Significant cost increases have occurred for “FGD system only” capital costs, yet the economies of scale do not seem to apply for units 600 MW and larger. Source: EUCG
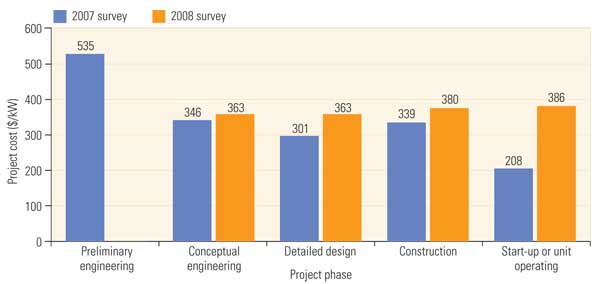
7. Reach for the sky. In the 2007 survey, “fully loaded” FGD system costs were much higher for preliminary engineering than for later phases and already completed FGD projects. The 2008 survey shows fully loaded costs to be very flat and independent of project phase. Source: EUCG
Total project costs reported in the 2008 survey were approximately 28% higher than those reported in the 2007 survey (which used data from late 2006), representing an average annual escalation rate of 14%. The data also show a project cost escalation rate from 2006 to 2007 of approximately 22%. This number may seem large, but it is very similar to escalation rates for other major utility projects during the same period. Also, the 2008 survey shows essentially no difference in fully loaded project costs from conceptual design through start-up (Figure 7). The conclusion we draw is that FGD project installed costs may be rising significantly, but costs have become more predictable.
—George W. Sharp (gwsharp@aep.com) is vice president of EUCG and manager, business intelligence for American Electric Power’s Generation Business Services Unit.