Even if you’ve never been in the market for a scrubber, you don’t have to face management and vendors as a greenhorn. Thanks to the EUCG, you can enter meetings with valuable information about other utilities’ costs—and how much your costs could rise between a scrubber’s planning and operational phases.
The EUCG is an association of electric utility professionals that provides a forum in which utilities can improve their O’M practices and construction performance. Now in its 24th year, the EUCG holds technical conferences and workshops twice yearly for the purpose of information exchange. The organization (formerly known as the Electric Utility Cost Group) is organized into committees and working groups by interest area, such as fossil, nuclear, and hydroelectric plants; transmission and distribution; financial management; and, the latest—IT.
One of the EUCG’s key activities is developing process and market benchmarks, unit reliability strategies, and best-practice applications to foster performance and cost excellence within the utility industry and competitive markets. The EUCG’s Fossil Productivity Committee (FPC) has 32 electric utility members reporting operating data on more than 300 individual coal-fired units. That number represents more than 30% of operating coal plants in the U.S., so the data can be considered representative of the entire U.S. fleet.
FGD benchmarks
The need for flue gas desulfurization (FGD) began, as so many industry changes do, with the feds. The Clean Air Interstate Rule (CAIR), issued in early 2005, targeted 28 eastern states and the District of Columbia for significant SO2 and NOx reductions. When fully implemented, the EPA notes that SO2 emissions will be reduced by 70% from 2003 levels. In fact, EPA projections show SO2 will be reduced by 45% by 2010. Early estimates by the EPA (2004) placed the annual cost of CAIR compliance at around $2.9 billion in 2010 and $3.7 billion in 2015 for 49 GW worth of scrubbers.
The power industry has responded to CAIR with numerous major investments in FGD and selective catalytic reduction systems. In fact, demand has been so high that many vendors now find themselves unable to provide equipment to those arriving late to the party.
The FPC of the EUCG, responding to members’ requests, designed and collected survey data on FGD technology and costs so members can benchmark their own facilities. The survey was conducted in early 2007, and detailed database results were provided to survey participants in March. The top-level results of that survey are presented exclusively to the readers of POWER as a service to the entire power industry.
The survey results have to be interpreted with a close eye to the peculiarities of each project site, and there are numerous factors that will influence costs and schedules. That said, it’s not a surprise that costs are rising and competition for production slots in key vendor shops is keen. However, there are industry trends associated with FGD projects that may prove useful to those considering similar projects. Our purpose is to report on those trends and let you interpret the data in light of the complexities of your emissions compliance program.
And the survey says . . .
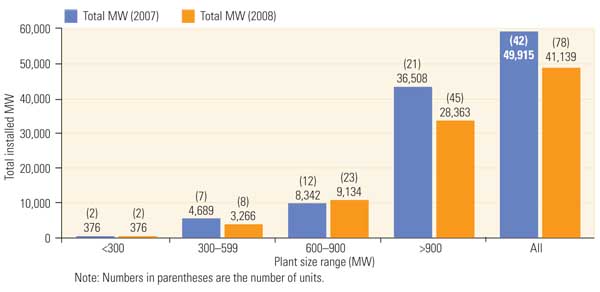
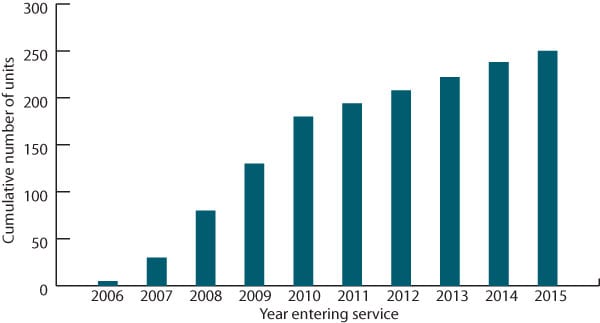
The FGD Survey data set covers over 70% of the forecasted FGD installations through 2012 (accounting for almost 50,000 MW) as published in a well-known industry consulting firm’s recent market forecast for the same period (70,000 MW) (Figure 1). The 300-MW increment used in this summary report was selected to keep the data set reasonably sized, but the full report has much greater detail. The survey coverage is consistent with the magnitude of the installations projected by the EPA, so the data set can be considered representative of the industry’s experience (Figure 2).
1. Full coverage. The EUCG flue gas desulfurization (FGD) cost survey includes almost 50,000 MW and 49 units in a range of sizes. Source: EUCG
2. Full life cycle. The survey covers FGD projects from those in the planning stage through operating systems. Source: EUCG
A few background system design characteristics and assumptions are summarized below:
- All the surveyed facilities are using limestone forced-oxidation technology.
- Tower technology selection varies by site, although more than half of the units chose spray technology (Figure 3).
- Over half of the respondents stated that their design includes a single-stack/double- flue configuration with another 41% specifying a single-stack/single-flue design. Only two plants reported using a single stack with more than two flues.
- There was more agreement with the flue material selection. At over 70% of surveyed plants the flue is fiberglass resin; 14% selected an alloy steel or C-276 clad flue.
- For FGD waste disposal, 53% of respondents are using an old or new landfill; slightly fewer (35%) are recycling at a wallboard plant.
- Reagent prep delivery is mostly by truck (51%), with the remainder using rail (29%) and marine vessel (20%).
3. Pick your flavor. FGDs with spray reactors were selected by over half of the respondents. Source: EUCG
These results will get you calibrated on the differences and similarities of FGD systems used in the study sample. Cost information follows in the second half of this article.
The design basis for the FGD survey reflected the wide variety of plants, locations, and fuels used in this industry. Survey results show that over 60% of the FGD systems were designed for less than 5 pounds SO2/mmBtu (Figure 4). The average size of the plant was 1,019 MW, and the average on-line date was 2008.
4. Capture the SO2. There is no consistency in the design basis for FGD systems among survey participants. Each company appears to have a different SO2 removal strategy. Source: EUCG
Pay to play
Defining average project costs is difficult without getting into the details of each of the 49 plants surveyed, but one conclusion is obvious: Project costs are rising rapidly. Just a couple of years ago fixed-price, turnkey contracts were available for FGD projects. No more. Many contractors won’t invest the time and money to prepare a cost-plus proposal without first negotiating a loss-on-ignition. It’s a seller’s market for major equipment and construction services.
The survey instructions requested that respondents define project costs for their just-completed, current, under construction, and/or planned FGD projects and to include the following line items, at a minimum, so that comparable data were reported:
- Project design costs
- New stack and ductwork costs
- Reagent prep method and costs
- Absorber island/reactor technology costs
- Site prep costs
- Wastewater treatment costs
- Balance-of-plant (BOP) costs
- Other direct costs (such as engineering and project management)
- Associated boiler work (such as boiler modifications and upgrading fans)
The average FGD cost reported by the survey sample is $319/kW, an increase of 21% since the last FGD cost study completed in 2005. The survey also requested enough financial data so that the cost of just the FGD system could be identified without other site-specific costs, such as the stack and wastewater systems.
The result: The base cost of a FGD system was $243/kW. The equation used to determine the FGD cost alone was to sum the FGD absorber/reactor, reagent prep system, FGD waste disposal system, and BOP costs. Keep in mind that these are averages for 49 separate projects that are detailed further below. Participants in the survey receive the entire cost database so they can perform customized cost studies.
The next level of capital cost data gleaned from the survey data is the "cost by plant size range" (Figure 5). Notice that the so-called "fully loaded FGD" costs for plants rated at 300 MW and up were consistently just above $300/kW installed. We expected more economies of scale for such large projects, but the data disprove that assumption. Costs increased almost 50% for plants less than 300 MW, which shouldn’t be a surprise.
5. Size doesn’t matter. "Fully loaded" FGD system capital costs were reported by unit rating. Source: EUCG
When the "FGD only" costs are extracted, installed costs do not seem to show any economy of scale but seem to still rise, although slightly, with increasing plant rating (Figure 6). The reason for the apparent disparity is not clear but may be due to the sample size per category, or perhaps the timing of the projects confounded the data.
6. Costs are consistent. "FGD system only" capital costs were also reported by survey respondents. Little difference in costs is seen with the larger plants. Source: EUCG
Cost data were collected in such a way as to also enable an analysis based on project status. The 49 projects surveyed were in various stages of completion, ranging from preliminary engineering to operational. The fully loaded project costs show an interesting, but not unexpected, trend: "Older" projects cost significantly less than "new" projects (Figure 7). And the difference is not trivial if you are responsible for predicting what that next project will cost.
7. Going up. "Fully loaded" FGD system costs show large increases in costs between already-completed FGD projects and those in the planning phases. Source: EUCG
Costs are escalating
One consistent theme emerges from the 12 major utilities representing almost 50,000 MW of scrubber projects: FGD retrofit project costs are increasing rapidly, even during the phased construction of similar units within a single utility. An average 30% cost increase in supplier pricing was reported from the start to completion of one utility’s multiple-unit FGD program (Figure 8). Slicing the data further reveals that the overall cost increases were attributed to the rising costs of alloy steels and the material-handling systems (Figure 9). Surprisingly, construction labor and concrete, showing a 28% increase, contributed the least to these increases.
8. Inflation. Individual utilities report significant cost increases from suppliers since the inception of their FGD program. Source: EUCG
9. Big spenders. Cost increases experienced by each reporting utility were identified as falling into one of eight major categories. Source: EUCG
—George W. Sharp heads business intelligence and commercial analysis for AEP’s Power Generation Contract Administration business unit. He can be reached at gwsharp@aep.com. For more information about the EUCG, contact Pat Kovalesky, executive director, at 623-572-4140 or visit www.eucg.org.