A fair amount of ink has been spilled in the commodities market over record natural gas storage inventories in the U.S. At the end of March, U.S inventories stood at 2,479 Bcf, shattering the previous record of 2,148 Bcf set in 1983.
The winter withdrawal season, when gas inventories decline as stocks are drawn down by heating demand, traditionally ends at the end of March. This year, however, it ended with the Energy Information Administration’s (EIA’s) March 22 report, which showed a net increase of 11 Bcf for the week ending March 16, putting stocks 766 Bcf above where they were a year earlier.
Gas stocks hit an all-time peak of 3,852 Bcf last November, and that was with end-of-March inventories at 1,581 Bcf, a mere 64% of what they were last month (Figure 1). This makes it a near certainty that at least some storage operators will begin running out of space later this year.
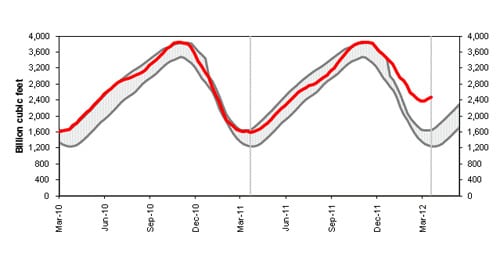
1. U.S. natural gas inventories at the end of March stood at an all-time end-of-season record of 2,479 Bcf. Source: EIA
Little Margin Left
How much space is there? First, one needs to draw a distinction between gas used to maintain adequate pressure and withdrawal rates (known as base gas), and gas available for withdrawal (known as working gas). Inventory levels reported by the EIA are normally given in terms of working gas.
According to the EIA the maximum total gas storage capacity for 2010 (the latest point for which data is available) was 8,763 Bcf. However, more than half of that is taken up by base gas. Total working gas design capacity as of April 2011 was around 4,353 Bcf. Though that’s 501 Bcf above the all-time high set in November, we ended this March with inventories almost 900 Bcf above where we were last year.
Net injections into storage during the spring and summer months (April to October) totaled 2,223 Bcf last year and 2,217 Bcf in 2010. This year we would need to add only 1,874 Bcf to fill the storage reservoirs to their brims. Unfortunately, the EIA’s Annual Energy Outlook is projecting total gas production (extraction plus imports) to grow by 0.46% over 2011 while consumption grows by only 0.21%. That would mean net injections of about 2,228 Bcf for 2012—assuming there were that much capacity.
Gas Storage Is Not Fungible
But it gets worse. Our storage network comprises more than 400 fields spread across 30 states, and moving excess inventory from one field to another is not always easy or even possible. As can be seen from the Department of Energy (DOE) map in Figure 2, storage capacity is in no way evenly distributed across the country—there are a number of heavily populated states with no reservoirs at all. And a few of these fields, or portions of them, are also inactive, but they are included in the EIA’s figures for total capacity.
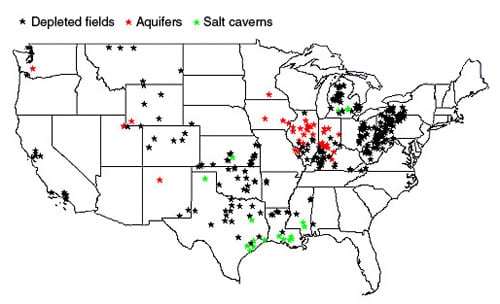
2. Most of the United States’ natural gas storage is concentrated in the Midwest, Mid-Atlantic, and South. Source: DOE
Reviewing the month-by-month injection patterns over 2007–2011, an average injection season for 2012—which is very close to what EIA is projecting—would put us at 90% capacity by mid-August and 100% capacity a few days into October.
Of course, all of this is without getting into the complicated economics and market behavior that governs why and how gas goes into storage. Suffice it to say it is not simply a matter of excess gas going into the nearest reservoir—far from it. What is likely, no matter what reservoirs hit their capacities—and many clearly will—is that the industry is facing the prospect of large quantities of gas being dumped onto the market late this summer, driving prices down even further, perhaps into negative territory in some regions. Hold on to your hat.
—Thomas W. Overton, JD is POWER’s gas technology editor. Follow Tom on Twitter. An earlier version of this story appeared on the POWERblog.