Thermohydraulic simulations can provide detailed heat recovery steam generator (HRSG) data to help determine the root cause of failures, predict the degree of wear from various mechanisms, and assess the overall thermal efficiency of the boilers. In this article, the results obtained from three case studies are presented to show the real-world benefits obtained through thermodynamic simulations.
Power plant staff needs reliable information on process conditions in heat recovery steam generators (HRSGs) to ensure safe operation and optimum performance. Current and historical operating data from the distributed control system (DCS) is a useful starting point, yet it does not provide detailed information on temperatures, pressures, or flows in all areas of the HRSG. This is achieved by running thermohydraulic simulations of the process. More detailed data can help in determining the root cause of failures or in predicting the degree of wear from a variety of mechanisms, including flow accelerated corrosion (FAC), fatigue, corrosion fatigue, and creep. Another advantage of simulation is that it can serve as a “test bed” to assess the impact of design or operating regime modifications on efficiency or unit life.
Three thermohydraulic HRSG simulations were performed using a commercial boiler simulation tool for real-life engineering assessments. The results are presented for the following case studies:
- ■ Impact and feasibility of decreasing the low-pressure (LP) economizer approach temperature in a triple-pressure HRSG to increase efficiency.
- ■ Feasibility of operating HRSGs designed for continuous duct firing without duct firing, driven by a need for more flexible plant load capability.
- ■ Predicting highest risk locations for FAC in HRSGs.
Software Description and Capabilities
A commercial thermohydraulic software—PowerPlantSimulator&Designer from KED GmbH—was used in these case studies. It allows the modeling of any type of boiler, such as biomass, conventional radiant boilers, HRSGs, or concentrated solar power stations. Each model is comprised of two distinct simulation components: the heat source (gas scheme) and the working fluid (water scheme).
The gas scheme is comprised of several elements that are typical for HRSGs in combined cycle plants. The process includes the following:
- ■ A gas turbine (GT) provides the flue gas, which is the heat source. The mass flows, temperatures, and gas compositions are input based on the different operating design cases and GT specifications.
- ■ A series of heat transfer tube bundles absorb the heat from the flue gas and transfer it to the working fluid contained inside. Tube bundle geometry and properties are input based on boiler design documentation, such as finning, material, spacing, number of tubes, etcetera.
- ■ At the end of the gas path, a stack element allows monitoring of the final exhaust temperature.
- ■ Optionally, duct burners can be present, which increase the steam production with additional fuel input.
- ■ Gas properties are calculated between each element in the gas path.
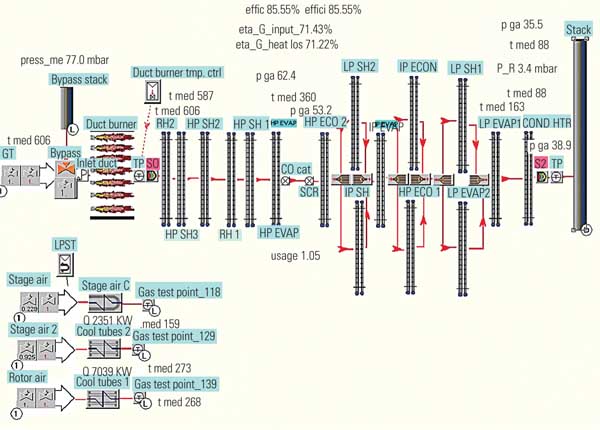
A typical gas scheme for a HRSG is shown in Figure 1.
 |
|
1. A typical triple-pressure heat recovery steam generator (HRSG) gas scheme is shown here. The gas inlet from the gas turbine is on the left. The gas flows through the different tube bundles to the stack. Selected simulation output parameters are shown, including heat input, temperatures, and net electric output. Courtesy: Tetra Engineering Group Inc. |
Once the gas scheme has been populated, the water scheme is setup to simulate the steam production and superheating. The process includes the following:
- ■ The heat transfer tubes modeled in the water scheme are imported and linked with the gas scheme elements. The tube bundles on both schemes share the same properties.
- ■ The drum elements are added and connected to the economizer, evaporator, and superheater (SH) tubes.
- ■ The natural circulation of the drum is calculated in a separate water scheme within the drum element based on downcomer piping and feeder geometry. Once again, the tube bundles are imported from the evaporator bundles in the gas scheme.
- ■ Control valves are added for the feedwater as well as any recirculation valves.
- ■ Any additional equipment such as deaerators are added.
- ■ Finally, the superheated (dry) steam outlet is connected to a steam turbine, which is in turn connected to a generator providing the output electrical power from the HRSG.
A typical water scheme for an HRSG is shown in Figure 2.
 |
|
2. A typical triple-pressure HRSG water scheme is shown here. The water connections for each pressure level are colored for clarity: low pressure (yellow), intermediate pressure (green), and high pressure (blue). The superheated steam from each pressure level is duplicated to simulate the second HRSG and fed to steam turbine slices connected to a generator (bottom right). Courtesy: Tetra Engineering Group Inc. |
All the input data is extracted from design documentation. Initially, the heat balance of the plant is used and the model is set to reflect the expected performance. Thereafter, operating data sent from the plant, usually taken from the DCS, is used to improve the model to better reflect the actual performance of the plant by taking degradation mechanisms such as fouling into consideration.
Increasing Thermal Efficiency: Approach Temperature Assessment
The following study assessed the impact on overall plant efficiency of lowering the LP economizer approach temperature in a triple-pressure HRSG.
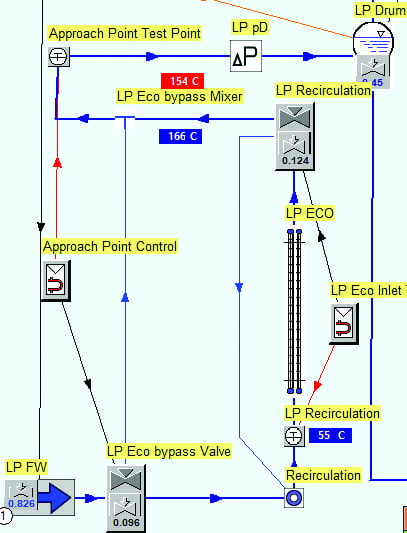
The plant was comprised of two GTs providing flue gas to two triple-pressure HRSGs with reheat. The steam produced was fed to a single steam turbine. A recirculation system was present to keep the LP economizer water temperature greater than 55C to avoid cold-end condensation. The final approach temperature was controlled by a three-way valve that allowed bypassing the economizer to cool the water before it entered the drum.
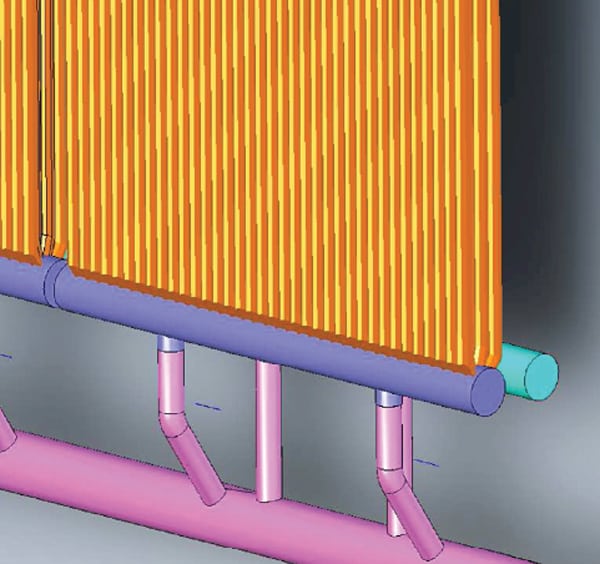
Approach temperature is the difference between the drum saturation temperature and the water entering the drum (or leaving the LP economizer). The general layout of this plant is shown in Figure 1 and Figure 2 for the gas and water schemes, respectively. More detail about the LP economizer configuration is shown in Figure 3.
 |
|
3. This image shows the low-pressure economizer water scheme in more detail. The approach temperature is shown in the red box taken from the test point before entering the drum. In this iteration, the temperature was 154C, which corresponds to an approach point of 8C. Courtesy: Tetra Engineering Group Inc. |
The HRSG simulation was set up as described previously. Once the inlet flue gas, heating surfaces, drums, and steam turbine were all input, the output was compared to guarantee design cases. Furthermore, DCS data from the plant was used for the final adjustments to ensure the simulation was as close as possible to actual operating conditions. At the time of the assessment, the plant was operating the HRSG with an 8C LP approach temperature. Three load cases were prepared corresponding to 100%, 75%, and 45% GT loads.
The main advantage of having an accurate simulation of a boiler or HRSG is that the impact of certain parameters can be investigated with no repercussions on pressure part or equipment integrity. In the context of this project, different test cases were run with approach temperatures ranging from the original 8C to 1C. The approach temperature of 0C was not considered as flashing upstream of the drum would occur. The emphasis of these test cases was to assess the impact on the integrity of the LP economizer, piping, and valves.
The main risks induced by lowering the approach temperature are the following:
- ■ Steaming in the economizer. If water evaporates in the economizer, this could lead to disruptions of the flow, deposit formation, vibrations, and flow stagnation, leading to tube-to-tube differential expansion.
- ■ Flashing to steam across the drum level control valve (LCV) and LP economizer recirculation valve, causing severe erosion through cavitation.
The material properties of all the susceptible components were reviewed and it was concluded that these would be able to withstand the increase in temperature.
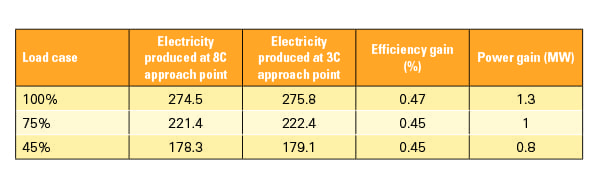
Lowering the approach temperature allows the water entering the drum to be closer to saturation, and therefore, speeds its evaporation to steam. This means a lower evaporator circulation ratio (amount of circulation required for incoming saturated water to evaporate) in the drum is required, leading to an increased steam production. As expected, using an approach temperature of 1C or 2C led to the highest efficiency gain. However, industry practice is to keep the approach point greater than 3C to give more room for error regarding control instrumentation and operating uncertainty. Decreasing the approach temperature from 8C to 3C resulted in a 0.8 MW to 1.3 MW power increase, depending on the load case (Table 1).
 |
|
Table 1. This table shows the power output and efficiency gain using a 3C approach point. Courtesy: Tetra Engineering Group Inc. |
The simulation demonstrated that there are no major risks to component integrity when using an approach temperature of 3C and it was predicted that this would lead to an increase in power production of approximately 1.3 MW at 100% GT load. Assuming a price of $38/MWh (which was the average annual wholesale price of electricity in the U.S. in 2017, according to the U.S. Energy Information Administration) and 8,000 operating hours per year, a 1-MW increase would represent a net financial gain of $304,000 per year.
Subsequently, the plant implemented the 3C LP approach point and confirmed a gain of 1.26 MW for the 100% load case. This proves the thermohydraulic simulation predictions were accurate within 3%.
Operating a HRSG Outside of Its Design Envelope
Presented below is the summary of a feasibility study for running HRSGs outside of their design envelope (without duct firing) to allow for more flexible plant operations. The plant evaluated was comprised of 10 gas turbines, each connected to a HRSG. Duct burners were installed at the facility between SH 1 and SH 5, and the gas flow is from right to left (Figure 4).
 |
|
4. This diagram shows a top-view schematic representation of the pressure part arrangement at the assessed plant. The gas flow is from right to left and the duct burners are installed in the gap between superheater 1 (SH 1) and SH 5. Courtesy: Tetra Engineering Group Inc. |
The process was initially setup based on design information, original manufacturer heat balances, and fired operation tests. The operating parameters were tuned to ensure that the model had a good concordance with expected performance and logged operating data from the plant. It is important to point out that simulated parameters always differ slightly from actual boiler parameters due to various factors. These particular boilers had more than 100,000 hours of operation and were subject to internal tube surface fouling. Furthermore, logged data has inherent errors from instrumentation and sensors. Additionally, original equipment manufacturer (OEM) heat balance calculations are often conservative to ensure they will be met or exceeded when commissioning units.
Once the model accurately reflected actual operating conditions, it was modified to assess the impact of running the HRSGs without supplemental firing. GT parameters, drum pressure, and feedwater flows were input. Meanwhile, thermocouples were installed at the plant on SH 2 headers, and selected tubes and jumpers on economizers. Four test cases were run without duct burners, the physical readings from the DCS and thermocouples confirmed the validity of the simulated model.
Without duct firing, there is less heat available in the HRSGs and steam production decreases. This leads to lower steam flow in the superheaters, causing higher tube metal temperatures. SH 1 and 2 are the most exposed to this effect as they are directly downstream from the GT exhaust. The simulation software predicted metal temperatures greater than 500C (confirmed by installed thermocouples) for the hottest row of SH 2.
The temperatures for SH 1 and 2 were outside the design envelope for certain GT loads. The tubes were made of T11 material, and the calculated minimum thickness criterion from the ASME Boiler and Pressure Vessel Code was not met at the full design pressure of 136 barg.
The simulation software allows calculation of temperatures between each element and also between each row of a heating surface. Only a couple of degrees difference are expected from row to row on SH 1 and 2, which is in accordance with OEM calculations. However, the temperature difference between these two modules becomes of greater concern with no duct firing.
In order to keep the SH 2 tubes compliant with the first section of the ASME Boiler and Pressure Vessel Code, the operating pressure should be limited to decrease the thickness requirements at the increased temperatures. New operating conditions were proposed with added conservatism to ensure safe and reliable operation under the new operating regime.
A simple finite element analysis was performed in a 3-D modeling and simulation software on SH 1 and 2 modules to assess the stresses induced by the temperature gradient calculated in the thermohydraulic simulation. This showed that the highest stresses would be at the connecting piping between the two modules. This piping was already designed with considerable freedom of movement and was expected to withstand the new thermal displacements.
As a result of the lower proposed operating pressures for unfired operations, the risk of steaming and flashing in the economizer, and associated piping and valves, was present. The lower pressures lead to lower water saturation temperatures. The thermohydraulic simulation provided the steam fraction across the water scheme and highlighted some potential steam production in the economizer piping and across the drum LCV.
A potential solution was modeled to mitigate this problem based on a partial economizer bypass. This would allow a fraction of the LP feedwater to bypass the economizer and mix at the outlet, which would reduce the temperature of the high-pressure economizer outlet to some degrees below saturation. The thermohydraulic simulation allowed engineers to calculate the required amount of bypassing to ensure the operating conditions were safe for the boiler.
Assessing Risk of FAC in HRSGs
The last case study presented in this article involves the use of thermohydraulic simulations to complement FAC assessments in HRSGs. FAC is a localized degradation mechanism that causes pipe wall thinning in power plants, which can lead to failures. At a fundamental level, FAC is a chemo-mechanical process where fluid chemistry conditions coupled with sufficient, near-wall, mass-flux enable accelerated dissolution of the internal magnetite layer.
FAC occurs primarily in carbon steel components carrying single-phase water or two-phase water and steam. It does not occur in dry steam. The rate of FAC is strongly dependent on piping material composition, temperature, and water chemistry. It is greatest in carbon steel components at temperatures near 150C when pH and oxygen concentration are low. At higher pH levels (near target ranges), the rate of wear rapidly diminishes, all other factors being equal. Geometry changes and other flow perturbations also have a significant effect by increasing local mass-flux and local flow. The flow conditions are also greatly affected by the steam quality in evaporators.
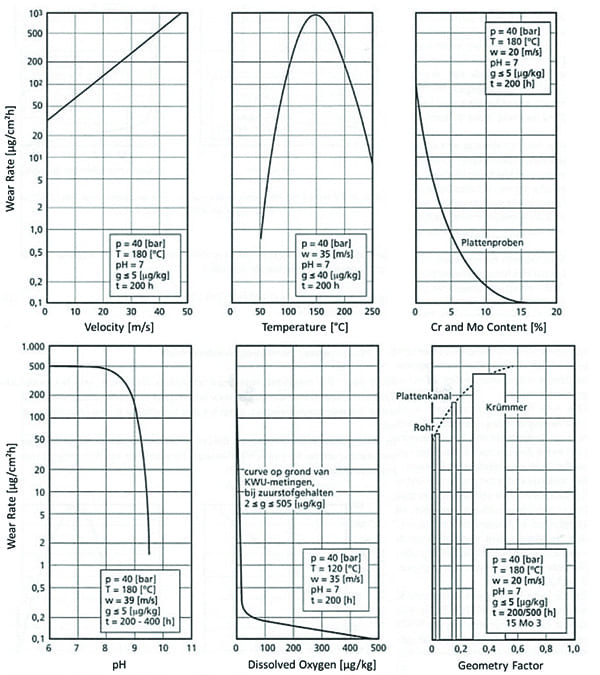
Figure 5 shows the wear rates induced by FAC for different parameters. Low-alloy steels with addition of chromium and to a lesser extent molybdenum greatly decrease susceptibility. The effect of these elements is to reduce the solubility of the protective magnetite layer and increase the adherence of the film, therefore making FAC wear less likely.
 |
|
5. The wear rates from flow accelerated corrosion (FAC) based on experimental data are shown for different parameters. FAC wear increases with higher velocities (top left), is maximum between 100C and 200C (top middle), and decreases with higher chromium and molybdenum content (top right). The wear rate also decreases with higher water pH (bottom left) and lower dissolved oxygen (bottom middle). Finally, manifolds (Krümmer) have the highest geometry factor (bottom right). Courtesy: Tetra Engineering Group Inc. |
In this case, the use of boiler simulations helped identify areas that could be at increased risk of FAC. The five contributing factors have been described in the previous section. They are material composition, fluid temperature, pH, oxygen concentration, and local fluid velocities/quality. Thermohydraulic modeling can predict the fluid temperatures, velocities, and steam quality in evaporators.
Water flows are relatively easy to calculate by hand, but the conditions within an evaporator circuit require complex iterative calculations. Thermohydraulic simulation considers the entire HRSG; therefore, the effect of FAC can be studied under different conditions. These can include a comparison with and without supplementary firing, conditions of low-load operation, and the effects of changing the evaporator pressure.
The boiler model was set up similarly to the previous study cases using design and operating data. Once the model was validated against actual operating conditions, at-risk components were identified based on contributing factors described above. The output data from the boiler thermohydraulic simulation was used as input in a spreadsheet using empirical calculations. The output data from the simulations used in this equation include bulk fluid velocities, steam mass fractions, and temperatures. Other parameters were extracted from design documentation, such as the geometry of the components. Water chemistry parameters, such as pH and dissolved oxygen, were estimated based on operating data.
The outcome of the assessment provided a ranking of the most-FAC-susceptible components of a HRSG under actual operating conditions. This could be used to create focused inspection plans including ultrasonic testing and borescope surveys. Thermohydraulic simulation also helps to troubleshoot any FAC issues identified in evaporators. The main benefit of using thermohydraulic simulations to complement FAC studies is the ability to get flow and temperature data that would otherwise be unknown. ■
—Jean-Mark M. Monnac is a project engineer with Tetra Engineering Group Inc. (tetra-eng.com).