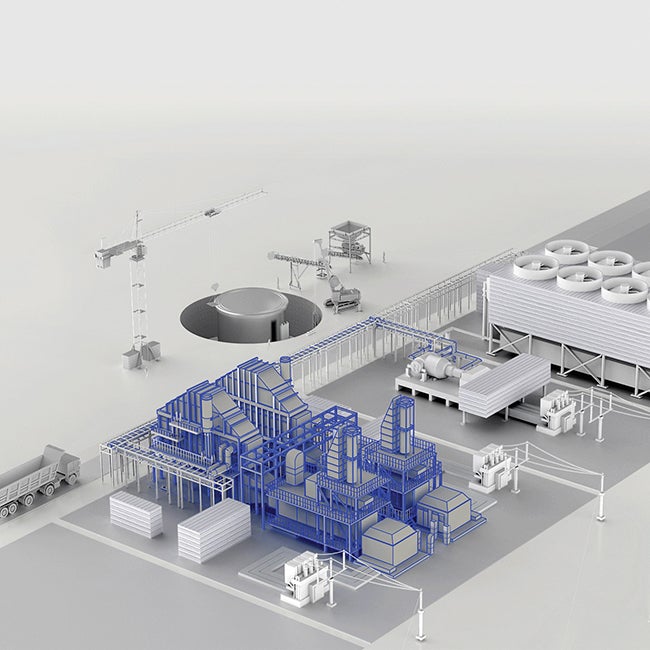
Investor-owned electric utilities are chartered to provide cost-effective and reliable electric service. An important element in ensuring the reliability of the electric system is a proactive preventive maintenance program. One of the tools available to identify areas of possible failure is the thermal imaging camera, which can capture an image and rapidly display areas of varying temperatures in different colors without contact. This allows for the visual determination of specific equipment elements that are operating at higher temperatures than adjacent elements. Higher operating temperatures can be an indicator of potential problems.
This article discusses planning, operation, and documentation procedures designed to effectively use the thermal imaging camera as a critical element in an effective reliability program. All thermograms included here were taken with a FLIR ThermaCAM P45 infrared camera.
Camera Setup and Operation
Prior to taking thermal images of equipment, it is important to become familiar with how to operate the camera. Once that is fully understood, attach all the required cables to the camera and turn it on. Make sure that both the camera and the viewfinder are focused, if the viewfinder has such an adjustment (Figure 1). Viewfinders are recommended for working outdoors, and external monitors are recommended when working indoors. In addition, take care to ensure that direct sunlight does not enter through the eyepiece, which would damage the video display. It is a good idea to cover the lenses with lens caps and to remove batteries from the camera when it is not in use.
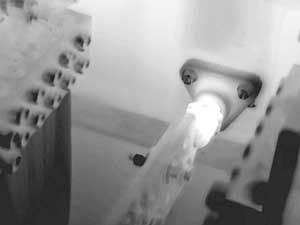
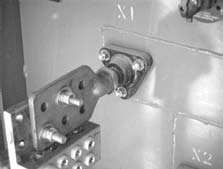
1. Focus the image. A focused image is not only easier to view but it also looks more professional, and the apparent temperature will be higher when viewing a hot spot. Courtesy:City Light and Power
Once the thermal images are captured, level, distance, emissivity, and span can be changed in post-image processing. Here are some camera-setting suggestions to optimize the usefulness of your thermal imaging camera.
Pick a Color Palette. Though a number of color palettes are available in infrared cameras, experience has shown that black and white provides the best resolution for scanning and focusing. When scanning large smooth surfaces, color can help detect subtle temperature changes. It is important to note that images stored on the PCMCIA card are saved as raw data that can be analyzed and manipulated later.
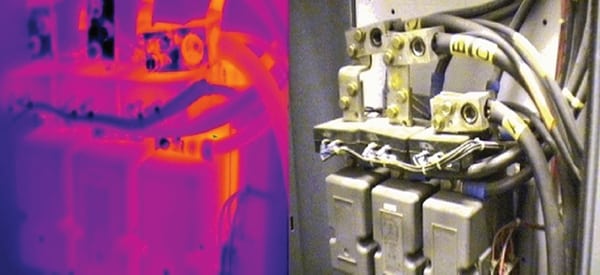
Set Level and Span. Temperature span is like "Thermal Contrast." In fact, it is similar to the contrast control adjustment on television sets. Level is like "Thermal Brightness" and is similar to the brightness adjustment on television sets. This is often referred to as thermal tuning. Figure 2 shows an example of proper temperature span setting on an ammonia injector heater electrical control panel. From the thermograph it appears that one fuse is blown. Thermal imaging can also detect such things as balanced and unbalanced loads, as shown in Figures 2 and 3.
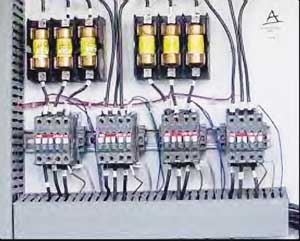
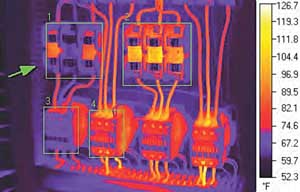
2. Confusing options. This ammonia injector heater electrical control panel appears to have a blown fuse. Courtesy: City Light and Power


3. Unbalanced load. The ammonia injector heater electrical control panel wires (L) are fiberglass-wrapped insulation and have unbalanced electrical loads (C). A infrared scan after the loads were balanced (R) showed a more even temperature spread. Courtesy: City Light and Power
Consider Distance and Temperature. It is important to consider the effect of distance on the accuracy of the thermal image captured. If the thermal image is captured from too far away, any small areas of high temperature will be difficult to detect because the lower temperature of adjacent areas is averaged along with the hot ones.
As an example, using a 150-inch to 1-inch lens will require that the image be captured at a distance of 12.5 feet for a 1-inch target (150/12). To measure a ¼-inch target, the image must be captured at a distance of 37.5 inches. Conversely, to capture the ¼-inch target from 12.5 feet away, a 4 x lens — 600-inch x 1-inch — will be required.
The following additional factors must be carefully considered to obtain good temperature measurements:
-
Camera focus. Infrared radiation is a form of electromagnetic radiation that is composed of long and short wavelengths. Infrared and visible light travel at the speed of light, and can be reflected and refracted. When the image is out of focus, the accuracy of the detected temperature is negatively impacted and data are lost.
-
Temperature range. Temperature range is important because out-of-range data cannot be recovered.
-
Operating distance. Operating distance is important in considering spot size ratio.
Just remember FoRD (Focus, Range, Distance) when you are setting up your camera, and you’ll get accurate temperature measurements.
More Factors to Consider
At this point, your camera is calibrated and all the important adjustments have been determined and set. Now you must consider how the object of your attention might affect the images collected by the camera.
For example, you must consider the target emissivity and background temperature, although as a secondary measure, emissivity can be corrected in post-image processing. Also important are the equipment operating conditions, such as operating load and status when the thermal images were taken. The thermal mass of the target also can affect the infrared signature. Finally, the effects of ambient temperature, pressure, and humidity on heat transfer at the time the thermal images were taken must be considered. Here are some practical suggestions for managing these issues.
Reduce Reflectivity. It is important to consider reflectivity when capturing thermal images. Reflectivity is a critical element in the apparent and actual image, especially on objects with low emissivity. To measure the background temperature, a diffuse reflector is recommended. To create a diffuse reflector, take a piece of wrinkled aluminum foil and attach it to a 12-inch x 12-inch piece of cardboard. Aim the camera at the foil and capture and save the image. When capturing the image, select a number of areas and obtain the average temperature. Enter this temperature as Tamb, or Treflect, or background temperature with an emissivity of 1.0.
When taking thermal images, reflections of other objects must be identified. For example, reflections could be produced by the sky or from the heat generated by the camera operator. As a check, the camera can be redirected to determine the heat or cold sources behind the camera operator. If the target is small enough, a screen can be erected to block any reflections on the target. If a phantom or ghost temperature is detected, the signature of the source must be investigated. If the source of the phantom temperature sources cannot be determined, consider capturing the image from a different perspective.
Tame Emissivity. Emissivity, sometimes called emittance, is related to absorption and is another intricate piece of the infrared puzzle. The higher the emissivity of the object, the more the material will radiate infrared energy. To determine the emissivity of an object, attach a 1-inch-long piece of Scotch 33 black electrical tape with known emissivity to the object, set the camera emissivity to 0.95, and obtain a temperature reading of the tape. Then obtain a temperature reading of an adjacent area and adjust the emissivity so the temperatures of tape and the adjacent area are the same. Under certain conditions, this procedure may not produce the desired results. As an alternative, obtain a sample of an equivalent material and then repeat the procedure.
It’s important to note that errors in emissivity vary with temperature. In Figure 4 points Sp 1 and Sp 2 are measuring a can with warm water; there is a 40.1F apparent temperature difference (149.6F – 109F) between the areas with and without the tape. Sp 3 and Sp 4 have cold water; there is a 10.4F apparent temperature difference (54.7F – 44.2F).
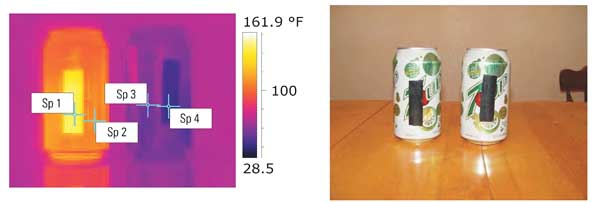
4. Taming temperatures. Testing the emissivity of a material illustrates how measured temperatures can vary. Sp 1 and Sp 2 are measuring a can with warm water; there is a 40.1F apparent temperature difference. Sp 3 and Sp 4 have cold water; there is a 10.4F apparent temperature difference. Courtesy: City Light and Power
Consider Heat Transfer. Thermal energy always flows from hot to cold, and its rate of flow is mainly determined by temperature differences. Heat is a form of energy that flows by radiation, convection, or conduction heat transfer.
With radiation, heat energy travels through the air or a vacuum from one object to another based on the temperature of the two bodies and their color and shape. Convection is usually a function of the velocity of a fluid medium, such as air blowing across a radiator. Conduction just requires a temperature difference within a body, such as a warm hand on a can of cold soda.
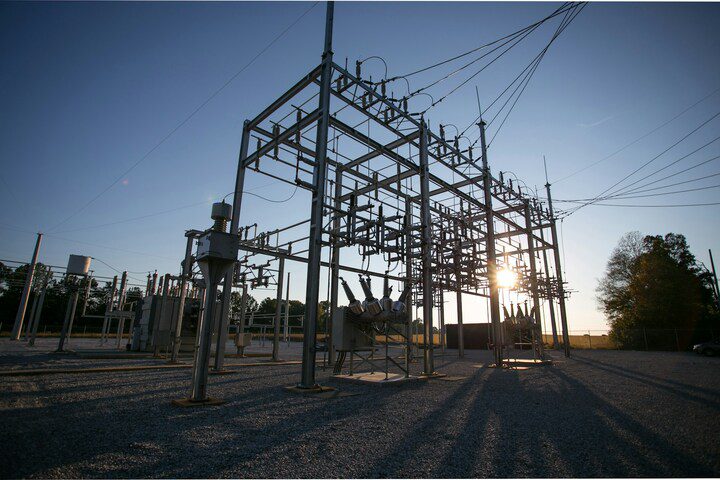
Take a Transformer’s Temperature
Because transformers are extremely expensive and essential to the proper functioning of electrical systems in a plant, they are a good example of the effective use of thermography (Figure 5).
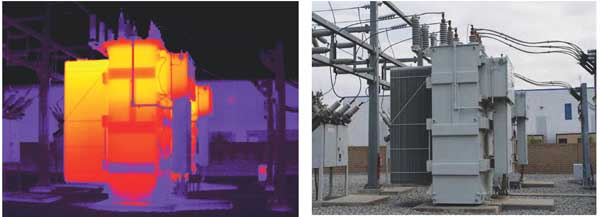
5. Transformer inspection. A thermogram of a 66-kV/12.4-kV transformer shows all is well during this inspection. Capture and record a baseline or footprint to compare for future inspections. You will need data for the trending. Courtesy: City Light and Power
When taking thermal images of transformers, the effect of the heat transfer in the insulating oil must be considered. Although it’s not necessarily a cause for concern on other equipment, a temperature rise of 5 degrees on an oil circuit breaker or load tap changer could indicate a serious problem, so check oil levels prior to taking thermal images of transformers.
Next, capture and record a baseline or footprint to compare for future inspections (Figure 6). You will need this data for trending. It is a good idea to take thermal images of bushings, lightning arrestors, radiators, fans, load tap changers, and ground connections. Confirm the fan settings and then operate the fans, if possible. Take thermal images of the cooling tubs and radiators to identify uneven heat distribution or blocked tubes or radiators.
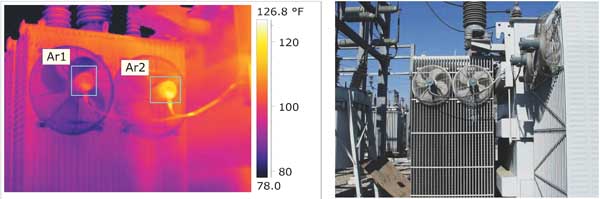
6. Too hot to handle. A later inspection of the 66-kV/12.4-kV transformer cooling fans
clearly shows a failed fan motor. Courtesy: City Light and Power
In this 66-kV/12.4-kV transformer, the forced air-cooling circuit tripped out because of a bad fan motor. Some emergency switching was performed to reduce the secondary load on the transformer. Evaporative coolers were installed before the oil temperature became critical.
Write Your Reports
Once the thermal images have been taken and possible areas of concern have been identified, a report should be prepared indicating the findings and possible areas of additional investigation. This report should be retained for data comparison with subsequent thermal measurements so that changes in temperature under equivalent operating conditions can be used for preventive maintenance.
As a general rule, the document will be easier to read if similar topics are grouped together. In addition, it is useful to number each section and include a table of contents. This makes it easier to locate a specific topic. During the training process, divide the procedure into separate, distinct steps to make them easier to follow. The document should be clearly written, with the actual procedure documented separately from the ramifications of failing to test equipment. Finally, make sure the report clearly notes the differences between actual and differential temperatures.
Here are my suggested sections for a well-written thermography report:
-
Location of substations, transmission distribution (overhead and underground), generation plants, circuits, or other equipment on a grid map
-
Background, including previous thermography reports and results
-
Purpose of the report
-
Pretest procedure: test plan, equipment list, obtaining test equipment, calibration
-
Test procedure: using test equipment, measurement techniques, special conditions
-
Post-test procedure: reports and recommendations
-
Data collection forms
-
References used in the report
-
Terminology
-
Example calculations
More information on infrared imaging is available at www.goinfrared.com/electricalproblems. To download technical reference materials or view webcasts on IR technology and noncontact temperature measurements, visit www.goinfrared.com/IRdata.
Acknowledgements: The author wishes to thank the Infrared Training Center at FLIR Systems, City Light and Power Inc. and support staff, and Fernando Calderon, PE with AC Electric Systems for their assistance in preparing this article.
— Contributed by Gary Updegraff, a Level III thermographer for City Light and Power Inc., a second-generation lineman, and a member of the International Brotherhood of Electric Workers Local #47 for 30 years.