PREVENTIVE MAINTENANCE
Stop valves from leaking money
Testing valves for leakage costs little but can save a lot. Energy drops across many valves exceed 1,250 Btu/lb, and leakage rates can be higher than 1,000 lb/hr. In a plant burning fuel priced at $5 to $10 per million Btu, a single valve with a modest leak (Figure 1) can account for $50,000 to $100,000 in lost fuel costs annually. That’s at least an order of magnitude greater than the $3,000 to $6,000 cost to replace it.
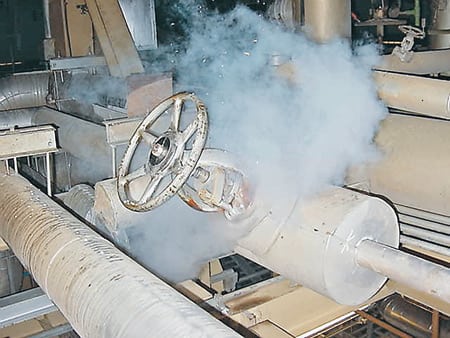
1. Look familiar? Over one year, the cost in wasted fuel of ignoring a leaking isolation valve is typically many times the cost of replacing it. Courtesy: Valvtechnologies
The losses multiply quickly in a typical power plant, which may have hundreds or thousands of valves. By wasting precious fuel, leaks can raise a generating unit’s heat rate by as much as 1% to 3%. Another penalty is the cost of producing the makeup water that literally goes down the drain.
First measure, then control
Most power plants consider a certain level of energy losses and leakage acceptable. Traditionally, detecting leakage losses has been challenging and time-consuming, and leakage rates have been nearly impossible to pin down. A relatively new technique, ultrasonic emissions testing (UET), can detect and quantify energy losses by relating the characteristics of sounds produced by leaking valves to their leakage volume or rate. As steam, saturated steam, or water moves from a high-pressure line through a leaking valve into a lower-pressure line, it produces turbulence. The nature and the level of turbulence correlate with a measurable and unique ultrasonic signal from the valve seat or area with a leak surface.
Deriving the leakage rate from the amplitude of the signal is analogous to calculating the flow rate through an orifice or constriction using the Reynolds Number. The same variables on which orifice flow calculations depend influence the relationship between the sound signature and the leakage flow rate. These variables include the pressure differential across a valve or orifice, its geometry, and the properties of the fluid being controlled.
In practice, the level of the acoustic signal is measured against background noise to isolate the sound energy associated with the leakage. Measured levels and known values of variables are entered into knowledge-based software that compares the inputs with numbers in an extensive database. The database, developed over the past decade, contains all relevant parameters, including signal levels and laboratory-measured leakage rates for many valves operating under different conditions. The software correlates the test data to the lab data and calculates the leakage rate of the valve under scrutiny with proven accuracy.
Comparing measurement methods
Another technique for detecting and quantifying valve leakage is thermography. Like "night vision" cameras and goggles, thermography uses infrared imaging to measure the heat energy emitted by an object. It can detect even small surface temperature variations inside a pipe.
Testing for leakage requires making several measurements upstream and downstream of a valve and across its body. If the conditions in a pipe are known, the surface temperature gradient can be used as a model to predict the heat flux or the temperature gradient inside it. Heat-transfer programs correlate the level of heat flux to the energy loss or leakage of the valve.
Although thermographic testing is far more common than UET, there are situations where thermographic results must be carefully interpreted:
- An elevated downstream temperature could be produced by residual heat from a recent cycling of the valve. In this case, thermographic data could be misleading.
- UET identifies the leakage at the source and measures it against background noise. With thermography, it is far more difficult to isolate valve leakage from other potential heat sources.
- A leaking valve will always emit an ultrasonic signature. But if the leak is in a saturated environment, it may not produce a temperature rise downstream.
- Thermographic testing may require removing large amounts of insulation from multiple locations along a pipe. UET only requires drilling a few, easily pluggable 1/2-inch holes in the pipe’s aluminum jacket to accommodate a 3/8-inch-diameter probe to make contact with the valve and the adjacent pipe (Figure 2).
- UET gives immediate results, but thermographic measurements must be mathematically or computationally modeled to determine leakage rates.
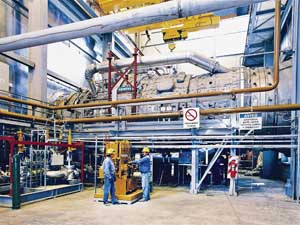
2. Probing the pipe. Ultrasonic emissions testing is nondestructive, intrinsically safe, and nonintrusive to normal plant operations. Courtesy: Valvtechnologies
Theory into practice
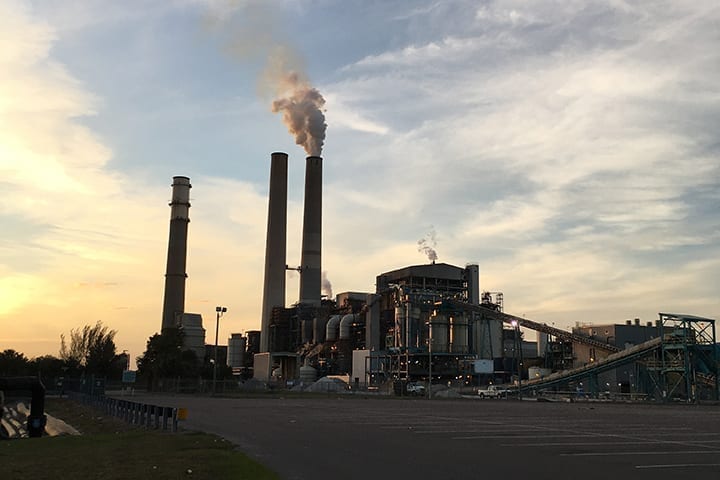
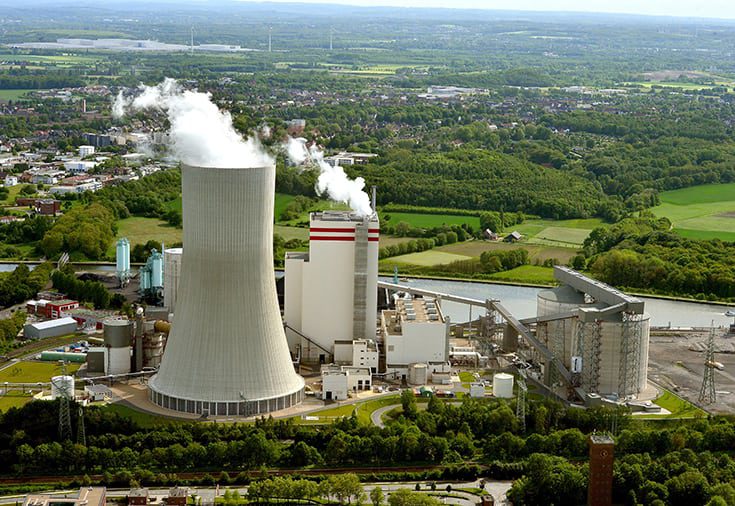
AES Red Oak (Figure 3) is an 832-MW gas-fired 3 x 1 combined-cycle plant in Sayreville, N.J., that entered commercial service in September 2002. An energy trading company buys power from the plant under a 20-year tolling agreement that includes incentives for improving its heat rate.
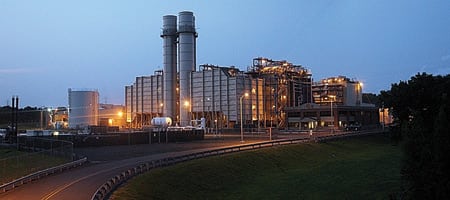
3. Do it yourself. The AES Red Oak plant in New Jersey found that top-quality shutoff valves often weren’t installed under its turnkey contract. An ultrasonic testing and valve replacement program paid immediate dividends in the form of lower unit heat rates. Courtesy: AES
At the plant, which was built under a fixed-price contract, operators soon became painfully aware that many of its isolation valves were of low quality and prone to leaks. Among the concerns that the leaks raised were excessive plant heat rate and the possibility of water induction to the steam turbine.
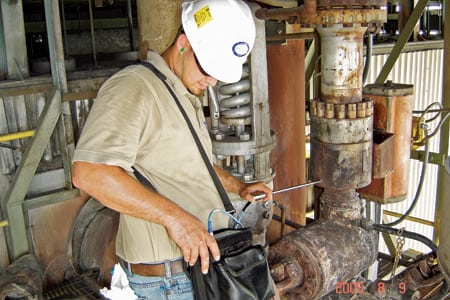
Marc Hain of AES Red Oak and Tony Glembocki of the valve designer and manufacturer Valvtechnologies (www.valv .com) teamed up to test those valves suspected of leaking. The two men targeted 50 valves for UET testing over the course of a half-day (Figure 4). "During the test, we opened and closed the targeted valves and adjacent block valves. When we compared the sets of readings, it was clear that we were getting meaningful results," recalls Hain.
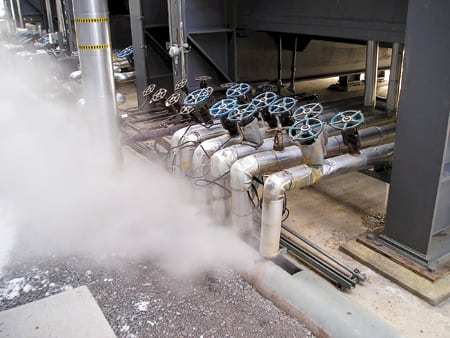
4. Time well spent. More than 50 valves were ultrasonically checked during a half-day of testing. Courtesy: Valvtechnologies
Although the plant’s time and budget constraints didn’t allow for a complete valve replacement program, the testing did isolate the leakiest valves, which then were moved to the top of the O&M department’s list for repair or replacement. Testing also identified the "good" valves, which were sealing tightly.
AES Red Oak then replaced the faulty valves with Valvtechnologies’ "absolute zero leakage" metal-seat ball valves. According to Hain, the result was dramatic: "an overall improvement in plant heat rate of 20% to 40%."
—Contributed by Marc Hain of AES Red Oak and Michael Flaherty and Tony Glembocki of Valvtechnologies.
PLANT DESIGN
Integrating plant and equipment models
Like power plant engineers, process plant engineers must design generating units to operate efficiently, cleanly, and profitably despite fluctuating costs for raw materials and fuels. To do so, they increasingly create virtual plants to enable evaluation of design concepts without the expense of building pilot-scale or demonstration facilities. Existing computational models describe an entire plant either as a network of simplified equipment models or as a single, very detailed equipment model.
The Advanced Process Engineering Co-Simulator (APECS) project (Figure 5) sponsored by the U.S. Department of Energy’s National Energy Technology Laboratory (NETL) seeks to bridge the gap between models by integrating plant modeling and equipment modeling software. The goal of the effort is to provide greater insight into the performance of proposed plant designs. The software integration was done using the process-industry standard CAPE-OPEN (Computer Aided Process Engineering–Open), or CO interface. Several demonstration cases based on operating power plants confirm the viability of this co-simulation approach.
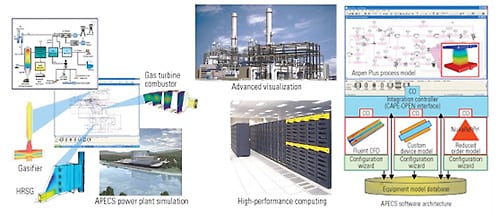
5. Can we talk? An overview of the Advanced Process Engineering Co-Simulator project for coupling process modeling and equipment modeling software. Source: NETL
When worlds collide
Worldwide, companies in the process industries spend about $500 billion annually to design, build, operate, manage, and maintain some of the most sophisticated and expensive engineered systems anywhere. The biggest difference between the design of a single plant and that of a product produced in volume is the enormous investment in the former that must be made before it can be fully tested. Although building pilot-scale and demonstration facilities to test design concepts is cheaper than building an actual plant, such facilities are still quite expensive, and they usually duplicate and provide in-situ measurements of only a portion of the proposed plant.
To save time and money, plant designers would be better served by a system that can model a wide range of designs using software. Many tools of this type are available, but until now designers had to choose between working at the process or the equipment level. Process simulators calculate material and energy balances and heat transfer rates and describe chemical reactions throughout the entire plant. By contrast, equipment models detail the geometries of machines and parts and the physiochemical processes that occur within them. For example, computational fluid dynamics (CFD) simulates the fluid flow inside pieces of equipment described by their actual geometry.
As a result, plant modeling engineers often end up working in separate groups in different departments of the same company. The knowledge generated by one group is transmitted manually and/or verbally (and often, not at all) to the other group. Questions such as how a change in the flow in a particular device will affect other parts of the plant, or whether a device will operate within its design limits, can be answered only by painstaking, iterative communication between the groups. Often, this severely limits the number of alternative concepts that can be investigated during the design of a new plant; there’s simply not enough time to do so.
The goal of NETL’s APECS project is to develop an integrated suite of improved software tools that engineers can use to simulate and visualize advanced plant design concepts. So far, its focus has been integrating predictive tools for plant-level cycle analysis with component models used to simulate equipment in the cycle. Two widely used commercial software products have been the first targets: Aspen Plus process simulation software from Aspen Technology Inc. (www.aspentech.com) and Fluent CFD equipment software from Ansys Inc. (www.ansys.com). The co-simulator was designed to facilitate the integration of additional simulation tools, such as custom equipment models based on proprietary legacy software.
Inside APECS
The APECS system uses the CO standard to interface process modeling software components used to design and simulate the operation of process plants. It exploits three major classes of CO interfaces: unit operations, physical properties, and reaction kinetics. The unit operation interface enables the use of Fluent equipment models in the Aspen Plus process simulation flowsheet (Figure 6). A wrapper was developed for the Fluent models to make them CO-compliant. It enables two-way communications with the Aspen Plus software, which is a CO-compliant process simulation executive. The use of CO ensures that any CFD model or proprietary custom model that uses the interface can be linked to the APECS software framework.
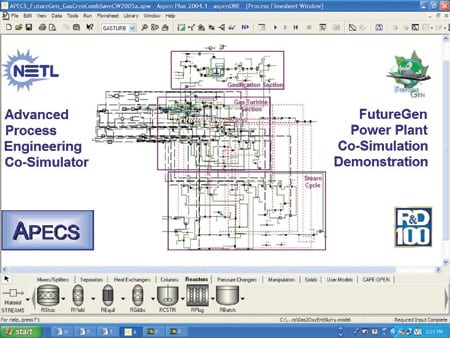
6. Symbol-driven. APECS uses symbols (bottom) to represent individual system components that designers must interconnect. This simulation flow sheet is being used on the DOE’s FutureGen zero-emissions coal plant project. Source: NETL
The CO interface also facilitates bidirectional exchange of stream information (flow rates, temperatures, pressures, and compositions) between the Aspen Plus applications and the Fluent models. Multidimensional CFD boundary conditions are mapped automatically to Aspen Plus streams and vice-versa.
The CO physical properties interface is used to transfer constant or temperature-dependent physical properties such as density, viscosity, heat capacity, thermal conductivity, and molecular weight. The reaction kinetics interface facilitates the automatic transfer of reaction stoichiometry and power-law parameters (Figure 7).

7. Virtual images. APECS simulation results are available as images. Examples include a gas turbine combustor (left) and an oxygen-fired, entrained-flow gasifier (right). Source: Ansys Inc.
The APECS system considerably reduces the time and effort required to integrate detailed CFD-based equipment models into plantwide simulations. Using alternative techniques, such integration either is not practical or requires weeks or months of effort by expert programmers. Using APECS, a Fluent CFD model can be systematically coupled to an Aspen Plus process simulation in an hour or two.
The time savings can be attributed to the use of the CO interfaces and several novel features. For example, configuration wizards enable a CFD engineer to quickly convert Fluent or custom equipment models to CO models that process engineers can use in Aspen Plus. Another example: Graphical user interfaces in Aspen Plus make it easy for process engineers to select equipment models from the model database, define CFD parameters and solution strategies, and view CFD results.
Integrated simulation in action
As part of the APECS program, Alstom Power was tasked with the responsibility to select and run three demonstration cases to test the software’s accuracy. Of the three cases, the simplest was a conventional, 30-MW coal-fired municipal power plant.
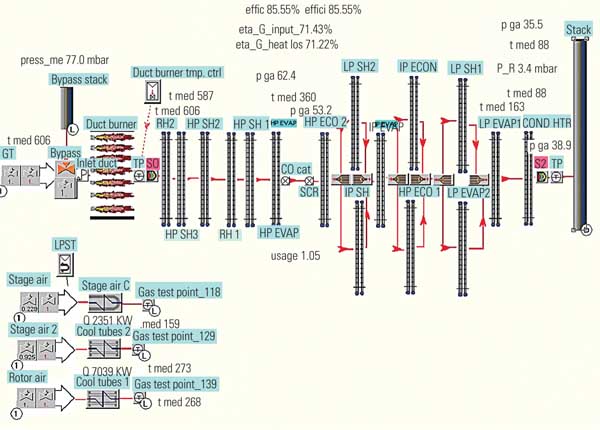
This plant’s front wall–fired, balanced-draft boiler produces 325,000 lb/hr of superheated steam at 900F and 900 psig. Each of the boiler’s burners has three different annular air supplies, and the combustion flow field is controlled by means of individual flow splits and swirl for each supply. Hot combustion gases rise through a superheater plate section and then fall through a low-temperature superheater (LTSH) section and a bypass cavity in parallel. The split of the flue gas flow through the LTSH section and the bypass cavity is determined by the backpressure applied by the bypass damper. The flue gas then flows up through a boiler bank and then down through a final exhaust cavity or duct. Before reaching the stack, the gas passes through an air preheater that warms it to the secondary air temperature required by the burners.
To simulate the combustion process, Aspen Plus virtually manipulated the damper position and the excess air concentration to achieve the design superheat steam outlet temperature. For a given fuel mass flow rate and excess air, the total air mass flow rate was calculated from stoichiometric reaction relationships. Using a 40,000-cell model, the Fluent application simulated the gas-side and steam-side flows associated with the heat-exchange processes occurring in the boiler.
A total of 19 CO parameters were defined for exchanging information between Aspen Plus and Fluent. For a given load and steam conditions, Aspen Plus calculated the steam mass flow rate required to produce a particular unit output. The simulation produced reasonable results over a range of loads. For example, the inertial resistance in the bypass channel, which was modeled as a porous medium, was determined to be the controlling parameter at high loads, while the exhaust oxygen concentration was found to be the controlling parameter at moderate loads. This demonstration case proved that integration of plant-scale cycle analysis and equipment simulation using CFD (Figure 8) can significantly improve the plant design process.
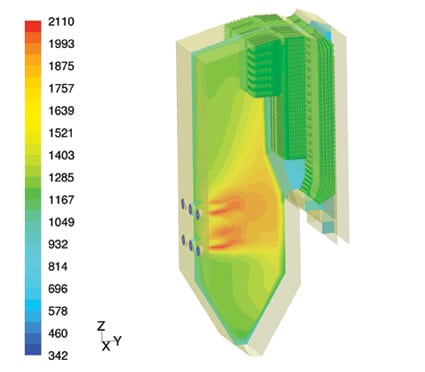
8. As hot as the sun. A 30-MW power plant used a CFD model of its coal-fired steam generator to improve control of superheat temperature. The figure shows the temperature contours in the boiler, in degrees Kelvin. Courtesy: Ansys Inc.
Ansys, Alstom, Aspen, and Carnegie-Mellon University are now working on Phase II of the APECS program, with DOE funding.
—Contributed by David Sloan and Woody Fiveland (woodyfiveland@power.alstom.com) of Alstom Power Inc., Stephen E. Zitney of the U.S. DOE’s National Energy Technology Laboratory, and Maxwell Osawe of Ansys Inc.
KNOWLEDGE MANAGEMENT
Pricing priceless knowledge
It’s hard to quantify the value of ideas. People like to put in their two cents on any given subject, but they only offer others a penny for their thoughts. You may find yourself asking the $64,000 question, yet get back an answer that isn’t worth the paper it’s written on. While poets and philosophers may say that knowledge is worth more than all the riches in the world, that adage isn’t enough to get a training budget approved by the executive finance committee. Priceless knowledge must be given a price tag.
"Knowledge is a critical strategic element that determines your competitive advantage," says Brad Kamph, president of the workforce strategy consultancy Interliance Consulting. "Knowledge isn’t something that can be easily bought or outsourced, yet it has everything to do with the long-term survival of any business."
Kamph’s opinion is surely shared by many utilities that are only now devising strategies to cope with the imminent retirement of their most experienced employees. "I realize that nearly 74% of my workforce will be eligible to retire in the next 10 years," says Charlie Lasky, VP of Fossil Operations for FirstEnergy Corp. "As a company, we’re constantly thinking about ways to capture the decades of skills and equipment knowledge that our employees have amassed over the past quarter-century."
Boomers eyeing the pasture
Power companies aren’t the only ones confronting the aging workforce issue. "Changes in demographics of the working-age population mean that more baby boomers are retiring," says James Holincheck, a research VP for the management consulting firm Gartner Inc. "You have to make sure that there’s enough talent in your pipeline to fill at least the senior positions."
No industry is immune. Last September, congressional hearings on the Comair flight crash that killed 49 focused on the impending shortage of air traffic controllers. Over the past three years, the number of controllers has dropped by 1,000 to 14,300, according to Doug Church, spokesman for the National Air Traffic Controllers Association. Some 25% of the remaining controllers will be eligible for retirement this year, and 75% by 2015.
The aerospace industry faces a similar problem. "The average aerospace production employee is now more than 50 years old; for engineers, the same number is 54," said John Douglas, CEO of the Aerospace Industries Association of America. "In 2008, 26% of aerospace workers will become eligible for retirement."
As for the electric power industry, the U.S. Bureau of Labor Statistics says that 30% or more of its existing workforce will be eligible to retire in the next five years, creating a 10,000-employee shortage in 2012. Those numbers are confirmed by a 2005 report from the American Public Power Association (APPA), "Work Force Planning for Public Power Utilities: Ensuring Resources to Meet Projected Needs." According to the report, which was based on a survey of 111 public utilities, half of respondents said that 20% or more of their employees would be qualified for retirement by 2010. Another 25% reported that between 10% and 20% would become eligible within the next three years.
The raw retiree numbers are troubling enough, but who’s retiring is even more concerning. According to the APPA report, "63% of respondents identified ‘skilled trades’ as being among the utility positions with the most likely retirements over the next five years," and "52% of respondents indicated that vacancies among the ‘skilled trade’ positions would be among the most difficult to fill."
Until recently, the U.S. was blessed with a steady stream of engineers from other countries seeking to improve their standard of living. That is no longer the case, due to tighter restrictions of the supply of H1B visas (for skilled workers) in the wake of 9/11.
"Talent has always been plentiful in the United States because people want to live here," says William J. Rothwell, professor of workforce education and development at Pennsylvania State University. "But with globalization, many of the people who would have emigrated to America now have more opportunities in their countries of birth."
Pricing skill and experience
The primary aging workforce problem isn’t the decline in total employee count but, rather, the loss of critical knowledge and skill sets. Retirees with decades of training and experience cannot be replaced by recent graduates still wet behind the ears. The analogy of the weakest link in a chain applies: One incompetent or poorly trained employee, or a poorly documented process, could cause a serious or fatal accident or a very costly forced plant outage.
Utilities and power companies can minimize their workforce losses by implementing an aggressive strategy to capture the knowledge of retirees and by hiring and training replacements for them. But because both strategies are expensive, companies need a way to express the cost of capturing and conveying knowledge in order to get it approved by top management. That’s why Interliance developed the mathematical "Cost of knowledge" model (see box) available on its web site (www.interliance.coma). The model calculates the costs of lost knowledge; allows a company to evaluate different recruitment, training, and retention scenarios; and finally, enables it to choose the one that best fits its needs.
"Based on industry standards and best practices and data gathered from within the company, the model provides management with not only a forecast of the cost to maintain its knowledge base, but also the potential return on investment," explains Kamph. "Organizations can fine-tune dozens of parameters to determine the cost/return ratio for alternative strategies for recruiting, new-hire programs, workforce development, process improvement, productivity enhancement, and other variables within the workforce supply chain."
The model was used recently by a large utility with an aging workforce. Its simulations suggested that by investing $4 million on workforce optimization, the utility could save about $60 million over the first five years and $200 million over a 10-year period.
"By identifying specific goals and objectives, this utility realized that it could do something about its aging workforce problem," says Kamph. "After devising some coping strategies, the utility is now executing them. The effort has already borne fruit: Even after cutting its capital and operating budgets, the utility’s knowledge base and its profits are much stronger."
Interliance’s cost of knowledge model doesn’t just work for large organizations. For example, a power company with 100 employees found that taking the model’s advice reduced its annual costs associated with attrition and personnel shortages by 5.9%. In this case, the projected savings over the next decade total $11 million.
Leveraging the numbers
That small company may be on its way to effectively managing its knowledge base, but aging workforces remain a problem for the power industry as a whole. For every type of power company, large or small, it will take a concerted effort by the entire organization to stem the knowledge drain.
Accordingly, the value of knowledge must be expressed not only in numbers but also in words understandable by everyone with a stake in the company, from senior executives to maintenance workers and shareholders. But figures that convey the full cost of knowledge and its loss remain important, because without them most knowledge-capture initiatives would never be funded.
"The actual cost of knowledge means more than some numbers taken from an annual report or even a more in-depth workout based on attrition forecasts," says Kamph. "Only by detailed analysis of the entire workforce supply chain can the true costs of knowledge be ascertained."
—Contributed by Drew Robb and Interliance Management Consulting (www.interliance.com).