Federal and state limits on emissions of mercury (Hg) from power plants typically require periodic or continuous measurement of Hg levels by approved reference methods (RMs) and continuous emission monitoring systems (CEMs). For example, the U.S. Environmental Protection Agency’s Clean Air Mercury Rule calls for the installation by January 1, 2009, of certified Hg monitors on all stationary sources that emit more than 29 pounds of the toxic pollutant annually. Reporting of data for compliance monitoring will begin on January 1, 2010. This allows less than 18 months for installation and certification of Hg CEMs and sorbent trap monitoring systems, and 2.5 years until mandatory reporting of their readings.
In July 2006, under a program organized by Lehigh University’s Energy Research Center, the performance of four commercial continuous and semi-continuous Hg CEMs and three sorbent trap (ST) systems from different manufacturers was compared in the field at Allegheny Energy’s Armstrong Power Station. The results were compared to the U.S. and EU reference methods. The project was conducted with the support of the U.S. EPA, EPRI, U.S. electrical utilities (particularly Allegheny Energy), Italy’s Ministry of Economic Development, and the Institute for Environment and Sustainability of the EU’s Joint Research Centre.
Based on the number of tests, the Armstrong program represents one of the most comprehensive examinations of Hg field measurement conducted in the U.S. Of the 294 total test samples (Table 1), 72 used the Ontario Hydro Method (OHM), 36 used samples obtained by the EU Reference Method, and 186 tests used ST samples.
Table 1. Tests performed at Armstrong Power Station. Source: Lehigh University Energy Research Center
The perfect host
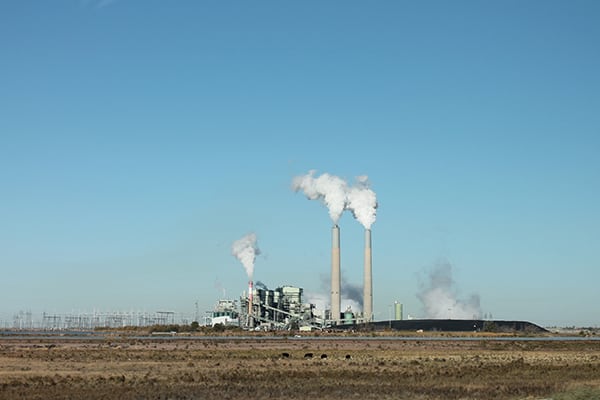
Allegheny Energy’s Armstrong Power Station (Figure 1) has two units rated at about 190 MW (gross) each. The station receives coal by truck from a number of local mines, as well as Virginia coal delivered by rail. Two electrostatic precipitators (ESPs) in series control particulate emissions. As a result, Armstrong’s stack opacity is very low, typically in the 3% range. Although the plant normally runs in baseload mode, it occasionally is used to help control grid frequency.

1. The tests’ host. Armstrong Power Station in Adrian, Pa., has two coal-fired units, each with a gross rating of 190 MW. Courtesy: Allegheny Energy Inc.
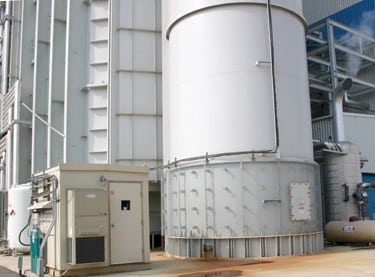
Units 1 and 2 at Armstrong discharge flue gas to the atmosphere through two 1,000-ft steel stacks enclosed in a common concrete liner. The 14.5-ft diameter of each stack makes the average flue gas velocity about 75 ft/sec at full load. The main CEM platform, about 350 ft above ground level, is accessible by an elevator.
Field testing of the CEMs was performed on Unit 2 in July 2006 by a joint team of U.S. and EU researchers. During the first 10 of 18 total test runs, the plant fired locally mined bituminous coals with high and variable Hg content. For Tests 11 through 18, it burned a low-Hg coal from Virginia.
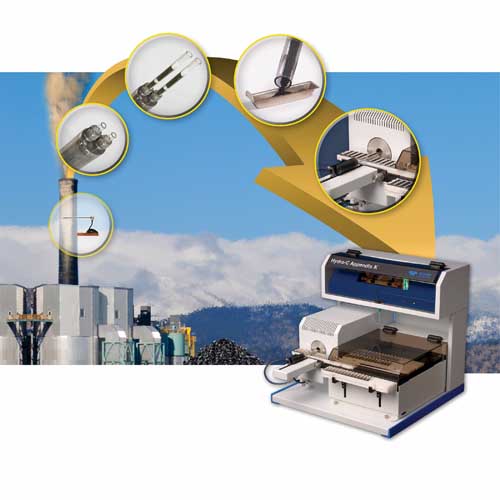
The continuous Hg monitors were located at ground level. The flue gas samples, extracted from the stack and conditioned by sample extraction probes, were delivered to the Hg analyzers by 450-ft-long heated umbilical lines. The samples were also sent to a semicontinuous Hg monitor located at the main CEM platform via a short, heated umbilical cord.
Two paired Ontario Hydro Method trains and two EU computer-controlled automated isokinetic trains obtained samples in accordance with the OHM and EN-13211 reference methods for Hg measurement. The samples were analyzed on-site and overnight in a Western Kentucky University (WKU) mobile chemical analysis laboratory.
Samples of flyash and coal were collected at least three times per day to make them more representative. The coal samples were collected from the coal mills, and the flyash samples from the ESP hoppers.
Coal composition measurements indicated that the properties of the coal being burned changed after Test 10 (Figure 2). During Tests 1 through 10, firing local coal produced Hg emissions in excess of 20 µg/wsm3. During Tests 11 through 18, a low-Hg Virginia coal was burned, lowering mercury emissions below 10 µg/wsm3. This change in coal properties allowed test data to be collected over a wider range of mercury concentrations, from 7 to 23 µg/wsm3. The Virginia coal had a 50% lower Hg content, as well as a lower chlorine (Cl-) content, than the local coals. The Cl-/Hg ratio for the Virginia coal was more than 50% higher than that of the local coals.

2. Half and half. The mercury and chlorine content of as-received coal used for the tests at Armstrong Power Plant Source: Lehigh University Energy Research Center
OHM: The gold standard
The Ontario Hydro Method is the oldest and most-proven RM. It is, however, manpower-intensive and time-consuming, and therefore expensive to use. The OHM was initially developed to support the U.S. EPA’s effort to characterize and inventory Hg emissions from the nation’s coal-fired power plants. After several revisions by the American Society for Testing and Materials (ASTM), it was finalized as standard test method ASTM Method D 6784-02. Since then, the OHM has been used by the EPA and other research organizations as both a research and potential compliance tool. The OHM is the EPA’s RM for measuring total (HgT) and speciated mercury.
At Armstrong Power Station, speciated mercury samples were collected from sampling ports at the CEM elevation using EPA Method 17. Two sets of field blanks and reagent blanks were taken at each location and analyzed for quality control purposes. Operators had to manually adjust procedures to maintain an isokinetic sampling rate. It took about two hours to collect a sufficient sample volume, confirming that OHM is a manpower-intensive and expensive Hg measurement method.
To comply with EPA Part 75 Relative Accuracy Test Audit criteria, OHM sampling must be performed in paired trains, and the paired samples must be within 10% of the relative standard deviation (RSD) of results. The precision of the OHM when used as an RM is a critical parameter. The OHM precision data, collected from various reports on pilot-scale and field measurement of gas-phase Hg by the OHM, indicated that RSD is in the 5% to 15% range (Figure 3).

3. OHM precision. Precision of the Ontario Hydro Method. Source: Lehigh University Energy Research Center
The OHM results were analyzed to determine their precision and other performance parameters. Despite changes in Hg concentration caused by changes in fuel quality and unit load, the HgT values, measured simultaneously by four individual OHM sampling trains located in two stack ports, were very close to each other.
Test set #1: Continuous mercury monitors
As mentioned, continuous mercury monitoring will be required at all stationary sources that emit more than 29 pounds of Hg annually. The Ontario Hydro wet chemistry and dry sorbent trap methods are sufficient for making total and speciated Hg measurements. However, they cannot provide the real-time data often necessary for environmental compliance. Mercury CEMs work like other combustion system CEMs in that they condition samples extracted from the flue gas stream and send their results to a remote analyzer. But the presence of mercury in flue gas in three different forms (HgP, Hg2+, and Hg0) greatly complicates the measurement process.
Mercury analyzers can be differentiated by their measurement principle. Among the principles used (Table 2) are: CVAF (cold vapor atomic fluorescence detection), with and without preconcentration by gold amalgamation, and AA (atomic absorption) with Zeeman background correction.

Table 2. Measurement principles and features of the continuous Hg emissions monitors tested at Armstrong Power Station. Source: Lehigh University Energy Research Center
At Armstrong, the raw gas-phase Hg (Hg2+ + Hg0) concentrations measured by the four CEMs were collected at the end of each test day, corrected to the standard EPA conditions, and analyzed. Figure 4 compares the measurements made by the CEMs on July 12, 2006, with those made using the OHM. It should be noted that a semicontinuous Hg monitor (Manufacturer D) was running only during the OHM sampling. Similar comparisons were made on all test days. The results show that—despite differences in Hg monitor location and measurement principle, sample conditioning, and length of the umbilical line—the Hg concentrations measured by different Hg monitors compared well, followed the same trends, and were in excellent agreement with the OHM results.

4. In good agreement. The gas-phase Hg concentrations measured by four continuous mercury emissions monitors on July 12, 2006, vs. the results obtained by use of the Ontario Hydro Method. Source: Lehigh University Energy Research Center
Figure 5 compares the gas-phase mercury concentrations measured by the Hg CEMs and the OHM. It, too, shows very good agreement between the two data sets (a 45-degree line would represent a perfect correlation). What’s more, the inter-unit comparisons are also very good, especially for the low-Hg coal.

5. Close correlation here, too. Another comparison, also on July 12, of the gas-phase Hg concentrations measured by mercury monitors and by the OHM. Source: Lehigh University Energy Research Center
A comparison of the absolute differences in readings also is illuminating. For the high-Hg coal, the absolute difference between the Hg CEM and OHM results was in the –1.5 to 3.4 µg/wsm3 (–8% to 19%) range. For the low-Hg coal, the absolute difference was in the –1.6 to 1.1 µg/wsm3 (–20% to 17%) range. The Hg monitor from Manufacturer A consistently underpredicted Hg concentration, compared with the OHM.
The differences between the results from other Hg CEMs and from the OHM varied from positive to negative values. For the high-Hg coal, the bias error was in the –3.1% to 10.5% range, while for the low-Hg coal it was in the –10.4% to 4.6% range. The average bias errors (with respect to OHM) of the four Hg monitors ranged from –4.2% to +10.5%. Figure 6 compares the bias errors of the four Hg monitors and presents the relative standard deviation (RSD) and relative confidence interval (RCI) values for the OHM.
Before making conclusions concerning calculated bias error, the statistical significance of the bias needs to be determined based on the values of RSD, RCI, and confidence interval (CI). As Figure 6 shows, the bias errors for all Hg CEMs tested at Armstrong are contained within the ±RSD interval. Using the RSD value as a criterion, one could therefore conclude that bias errors between the Hg CEM and OHM measurements are not statistically significant.

6. Bias crimes. The four monitors’ bias vs. the Ontario Hydro Method. Source: Lehigh University Energy Research Center
If the RCI value is used as a criterion, however, one may conclude that the bias error of some Hg CEMs is statistically significant, while for others it is not. A more rigorous analysis compared the interval estimates, namely the Hgavg ±CI values measured by the OHM and Hg CEMs. Table 3 summarizes the results of all three criteria used to determine the statistical significance of bias error. It shows that the bias errors of the units from Manufacturers A and D working on samples on low-Hg coal are statistically significant, as are those of the units from Manufacturers C and D fed samples of high-Hg coal. That means there is a bias in the CEM measurements that cannot be explained by normal variations in measured data.

Table 3. Comparing the statistical significance of the Hg CEM and OHM bias tests. Source: Lehigh University Energy Research Center
Test set #2: Sorbent traps
Sorbent trap testing at Armstrong Power Station was conducted in parallel with the OHM tests and in accordance with Appendix K of 40 CFR Part 75 regulations. The start and end times for the OHM and ST tests were coordinated to facilitate direct comparison of results.
Sorbent traps have been used to measure HgT in the flue gas of coal-fired units since 1990. A known volume of flue gas is drawn by a sampling train through a tube (sorbent trap) filled with a material that absorbs Hg. The content of the traps is then analyzed either on-site or in a laboratory to determine the Hg concentration in the stack flue gas. Most STs are designed to measure total mercury, HgT. Some traps, however, employ multiple sorbents to determine Hg speciation. Different manufacturers have developed different versions of sampling trains.
Sorbent trap methods are simple to use and offer similar precision and accuracy as Hg CEMs, but they are not designed for continuous sampling. However, they are well-suited for auditing mercury testing.
Paired traps are required and must show relative agreement. Each trap is composed of three sections. The first is used for Hg measurement, the second to quantify Hg breakthrough, and the third (a spiked section) to demonstrate analytical proficiency. As Appendix K states, the Hg breakthrough must be 5% or less of the first section’s mass. The relative deviation of the traps must be less than or equal to 10%. For low average concentrations (1 µg/sm3), the recently proposed revisions to Part 75 allow for a relative deviation of less than or equal to 20%. Spike recovery from the third trap section must be between 75% and 125%. Also, Appendix K requires the results to be corrected for spike recovery.
Sampling equipment for ST testing was provided by three manufacturers of sorbent traps. At Armstrong, some of the traps were analyzed on-site, but most were sent back to the manufacturers’ labs for off-site analysis.
A comparison of the HgT concentration values measured by the STs and OHM shows a very good agreement between the mercury concentrations measured by both methods (Figure 7). That was especially true when Unit 2 burned the low-Hg coal (the measured HgT values cluster together). For the high-Hg coal, the scatter in measurements is higher than for the low-Hg coal. For the high-Hg coal, the absolute difference between the ST and OHM results was in the –3.1 to 3.5 µg/dsm3 (–15% to 18%) range. For the low-Hg coal, the absolute difference was in the –1.7 to 0.7 µg/dsm3 (–19% to 9%) range.

7. Similar in performance. Comparing the HgT measurements of sorbent traps with those using OHM. Source: Lehigh University Energy Research Center
The ST test data were segregated into high-Hg and low-Hg sets when calculating test statistics. The results, summarized in Table 4, show that the average RSD, CI, and Hgavg ±CI values for ST Manufacturers I, II, and III-a were similar. Manufacturer III-b’s method and equipment produced slightly more precise results, compared with the others. Similar to the results obtained for the Hg CEMs, the precision of the ST tests conducted when Unit 2 was firing low-Hg coal at Armstrong was higher than for those when high-Hg coal was burned.
Next, the bias error of the STs with respect to OHM was compared. For the spike-corrected data, the average bias error in HgT concentration ranged from –4.7% to 5.1%. The bias error for the high-Hg coal was within the –1% to 6.6% range, while for the low-Hg coal, it was between –12% and 2.5%.
Figure 8 compares the bias errors of the four ST systems with respect to OHM, and presents the RSD and RCI values for the OHM. The statistical significance of the bias error was determined using the same approach as for the Hg CEMs. As the chart shows, the bias errors for all STs are contained within the ±RSD interval. As before, using the RSD value as a criterion for determining statistical significance, one could conclude that the bias errors between the STs and OHM measurements are not statistically significant.

8. Statistically significant, or not? The four sorbent traps’ bias error vs. the OHM. Source: Lehigh University Energy Research Center
However, using the RCI value as a criterion, one could conclude that the bias error of the sorbent trap from Manufacturer I (when fed samples of high-Hg coal) and that of the sorbent trap from Manufacturer II (working on low-Hg coal) are statistically significant. These results are shown in Table 4, which summarizes the results of all three criteria used to determine the statistical significance of bias error for the sorbent trap tests. Overall, these results confirm a very good agreement between the ST and OHM results obtained at Armstrong.

Table 4. Comparing the statistical significance of the sorbent trap and OHM bias tests. Source: Lehigh University Energy Research Center
Test set #3: EU Standard EN-13211
This European standard specifies a manual reference method for determining HgT concentration in the flue gas of a power plant stack. Similar to the U.S. RM, a specific-volume sample of the flue gas stream is extracted isokinetically from a stack over a certain period of time at a controlled flow rate. Particulate matter in the sampled gas stream is collected on a filter. The particle-free flue gas stream passes through a series of impingers (absorbers), which contain solution(s) for collecting gas-phase Hg. At the end of the sampling period, the filter and impinger solutions are analyzed in a laboratory.
The sampling equipment consists of a heated probe and a sampling nozzle made of titanium, a filter housing, a series of impingers, a suction unit with a gas metering device, and a flow controller. Depending on the type of impingers used, two different sampling arrangements may be employed: main stream and side stream. In the main stream arrangement, shown in Figure 9, all sampled flue gas flows through the impingers, while in the side stream arrangement only some of the flue gas is passed through the impingers. Depending on the arrangement, one or two suction units may be used.

9. Gently down the stream. A schematic of the EU sampling train with the main stream arrangement. Source: Lehigh University Energy Research Center
Figure 10 compares the HgT values measured by the two EN-13211 sampling trains and the two paired OHM trains. The correlation coefficient R2 of 0.9521 indicates a very good agreement between the data sets. The scatter in the HgT concentrations measured when low-Hg coal was fired is considerably lower than when high-Hg coal was burned.

10. Less mercury, less scatter. EN-13211 compared to OHM on a wet basis. Source: Lehigh University Energy Research Center
Again, the test data were divided into high-Hg and low-Hg data sets when calculating test statistics. The results show that the average HgT values measured by the EN-13211 and OHM methods were very close (within 0.5 µg/sm3) for both the high-Hg and low-Hg coals. The higher precision of the OHM could be attributed to the larger number of samples it used (two paired trains vs. two single trains for EN-13211).
The average bias between the EN-13211 and OHM readings was 2.9%. The bias for the high-Hg coal was 2.5%. For the low-Hg coal, the error was larger (3.8%) but still well within the ±RSD and ±RCI intervals of the OHM. As a result, one could conclude that the bias between EN-13211 and OHM is not statistically significant.
Comparison shopping
All mercury monitors and sorbent traps tested at Armstrong performed very well, although some performed better than others. All of the methods were close in terms of precision. Yet somewhat better precision was obtained on low-Hg coal, compared with high-Hg coal. This can be attributed to the low-Hg coal’s less-variable mercury content. The maximum bias was in the 10% range. Also, the precision of the OHM results obtained at Armstrong is comparable to that obtained at other sites.
Also, don’t forget that sootblowing interferes with Hg measurement. When sootblowing was initiated at Armstrong, the gas-phase mercury concentration measured by all Hg CEMs suddenly dropped. The cause of the drop is believed to be Hg adsorption/absorption on solid particles that were dislodged from tube surfaces by sootblowing and then entered the flue gas stream. To obtain good-quality, repeatable Hg measurements, you should not activate sootblowers during Hg testing.
Each plant is different, so it is difficult to extrapolate results from one power plant to another even if they both burn the same coal or blend of coals. This is why the various manufacturers were not identified by name. Because one size does not fit all, you have to test Hg monitors at your particular plant (using approved procedures) to determine their actual measurement performance characteristics (accuracy, precision, and drift).
—Dr. Nenad Sarunac (ns01@lehigh.edu) is a principal research engineer and associate director of Lehigh University’s Energy Research Center. Dr. Domenico Cipriano (cipriano@cesiricerca.it) is the head and product leader of the emissions monitoring group at CESI Ricerca, Milan, Italy. Jeffrey Ryan (ryan.jeff@epa.gov) is a senior scientist in the Air Pollution Prevention and Control Division of The Office of Research and Development of the U.S. Environmental Protection Agency. John Schakenbach (schakenbach.john@epa.gov) is an environmental scientist at the Clean Air Markets Division of the U.S. Environmental Protection Agency.