Combining concentrating solar power (CSP) with thermal energy storage shows promise for increasing grid flexibility by providing firm system capacity with a high ramp rate and acceptable part-load operation. When backed by energy storage capability, CSP can supplement photovoltaics by adding generation from solar resources during periods of low solar insolation.
The falling cost of solar photovoltaic (PV)–generated electricity has led to a rapid increase in the deployment of PV and projections that PV could play a significant role in the future U.S. electric sector. The solar resource itself is virtually unlimited; however, the actual contribution of PV electricity is limited by several factors related to the current grid.
The first is the limited coincidence between the solar resource and normal electricity demand patterns. The second is the limited flexibility of conventional generators to accommodate this highly variable generation resource. At high penetration of solar generation, increased grid flexibility will be needed to fully utilize the variable and uncertain output from PV generation and to shift energy production to periods of high demand or reduced solar output.
Energy storage is one way to increase grid flexibility, and many storage options are available or under development. In this article, however, we consider a technology already beginning to be used at scale—thermal energy storage (TES) deployed with concentrating solar power (CSP).
PV and CSP are both deployable in areas of high direct normal irradiance such as the U.S. Southwest. The role of these two technologies is dependent on their costs and relative value, including how their value to the grid changes as a function of what percentage of total generation they contribute to the grid, and how they may actually work together to increase overall usefulness of the solar resource.
Both PV and CSP use solar energy to generate electricity. A key difference is the ability of CSP to utilize high-efficiency TES, which turns CSP into a partially dispatchable resource. The addition of TES produces additional value by shifting the delivery of solar energy to periods of peak demand, providing firm capacity and ancillary services, and reducing integration challenges. Given the dispatchability of CSP enabled by TES, it is possible that PV and CSP are at least partially complementary (Figures 1 and 2).
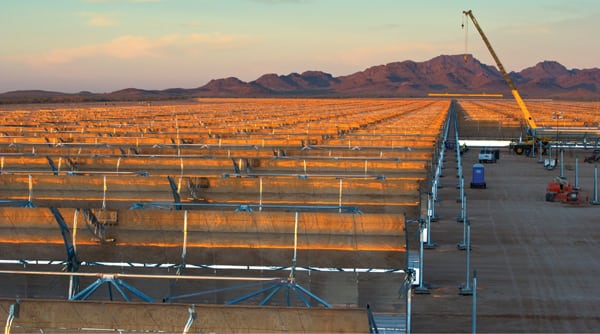 |
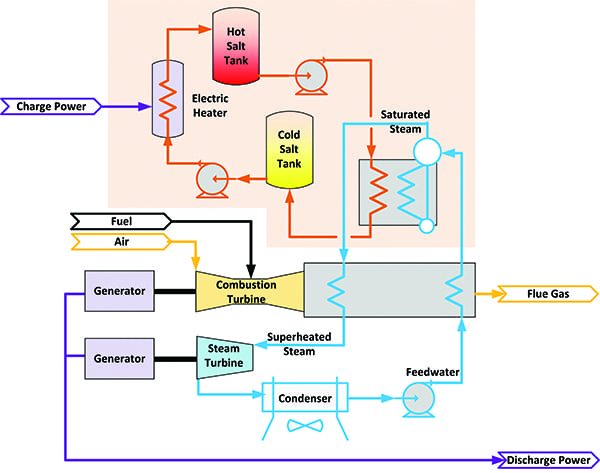
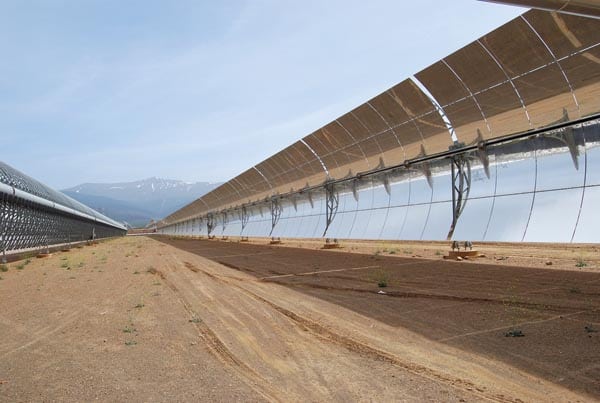
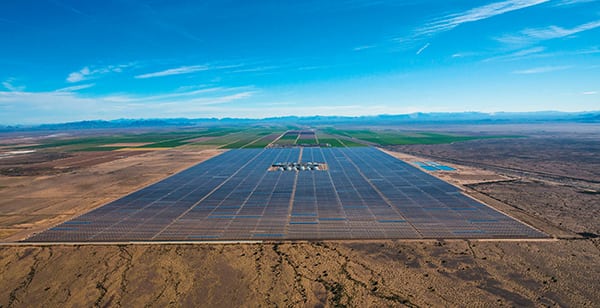
| 1. Concentrating on CSP technology. Crews are shown installing mirrored parabolic troughs at the Solana Generating Station in Arizona. The 280-MW concentrating solar power (CSP) plant is scheduled for completion in 2013. CSP technology uses mirrors to reflect and concentrate sunlight onto receivers that collect the sun’s heat. Courtesy: Dennis Schroeder |
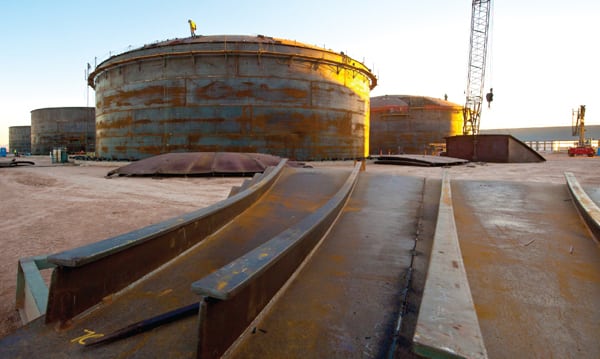 |
| 2. Storing solar energy. These tanks at the Solana plant will hold molten salts. Those liquid salt fluids remain very hot for several hours, so the energy stored in them can be recovered to produce steam that can be expanded in the steam turbine on demand to produce electricity later in the day. Courtesy: Dennis Schroeder |
The dispatchability of CSP with TES can enable higher overall penetration of the grid by solar energy by providing solar-generated electricity during periods of cloudy weather or at night, when PV-generated power is unavailable. Such systems also have the potential to improve grid flexibility, thereby enabling greater penetration of PV energy (and other variable generation sources such as wind) than if PV were deployed without CSP.
Challenges of Solar Deployment at High Penetration
The benefits and challenges of high PV penetration (feeding high percentages of solar generation to the grid) have been described in a number of analyses. At low penetration, PV could displace the highest cost generation sources and may also provide reliable capacity to the system. Figure 3 shows a simulated system dispatch for a single summer day in California with PV penetration levels from 0% to 10% (on an annual basis). This figure is from a previous analysis that used a production cost model simulating the western U.S. This particular scenario illustrates how PV reduces the need for peaking capacity due to its coincidence with demand patterns.
As penetration increases, the value of PV capacity drops. This can be observed in Figure 3, where the peak net load (normal load minus PV) stays the same between the 6% and 10% penetration curves. Beyond this point, PV no longer adds significant amounts of firm capacity to the system.
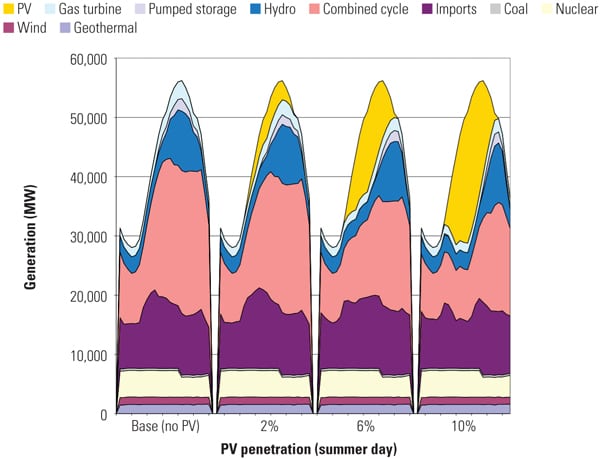 |
| 3. Syncing up with demand. This chart, showing a simulated dispatch in California for a summer day with PV penetration from 0% to 10%, illustrates how PV has the ability to reduce the need for peaking capacity due to its coincidence with demand patterns. Each set of curves represents a 24-hour day. Source: National Renewable Energy Laboratory (NREL) |
Several additional challenges for the economic deployment of solar PV occur as penetration increases. These are illustrated in Figure 4, which shows the results of the same simulation, except on a spring day. During this day, the lower demand could result in PV displacing lower-cost base-load energy, should CAISO dispatch PV first. At 10% PV penetration in this simulation, PV completely eliminates net imports, and California could export energy to neighboring states, if the cost of the exported power were attractive.
Several factors limit the ability of conventional generators to reduce output to accommodate the variability of renewable generation. One is the rate at which generators can change output, particularly in the evening, when they must increase output rapidly in a high-PV scenario.
Another limitation is the overall ramp range, or generator turndown ratio. This represents the ability of power plants to reduce output, which is typically limited on large coal and nuclear units. Accommodating all of the solar generation, as shown in Figure 4, requires nuclear generators to vary their output, which is not current practice in the U.S. nuclear industry. Most large thermal power plants cannot be shut down for short periods of time (a few hours or less), although brief shutdowns would be required to accommodate all the energy generated during the period of peak solar output. Additionally, many plant operators have limited experience with cycling large coal plants, and extensive cycling could significantly increase the cost of maintenance. (See “Mitigating the Effects of Flexible Operation on Coal-Fired Plants” and “Make Your Plant Ready for Cycling Operations” in the August 2011 issue of POWER or the magazine’s archives at https://www.powermag.com.)
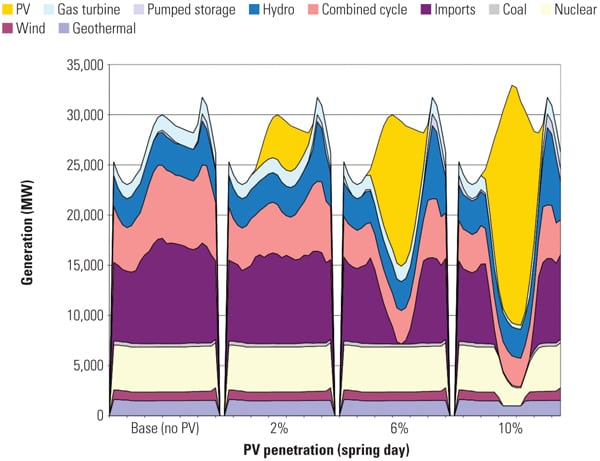 |
| 4. The impact of diminished demand. Simulated dispatch in California for a spring day is shown with PV penetration from 0% to 10%. During this day, the lower demand results in PV displacing lower-cost baseload generation, if PV is dispatched first. Source: NREL |
The ability to “de-commit” or shut down power plants may also be limited by the need to provide operating reserves from partially loaded power plants. As the amount of PV on the system increases, the need for operating reserves also increases due to the uncertainty of the solar resource, as well as its variability over multiple time scales.
Previous analysis has demonstrated the economic limits of PV penetration due to generator turn-down limits and supply/demand coincidence. Because of these factors, at high penetration of solar energy, increasing amounts of solar generation may need to be curtailed. Generator constraints would likely prevent the use of all PV generation potentially available in Figure 4’s 10% scenario. Nuclear plant operators would be unlikely to reduce output for such a short period. Furthermore, PV generation could be offsetting other low- or zero-carbon sources such as wind and geothermal generation.
Although the percentage of solar energy on the U.S. grid is currently far too small to result in significant impacts, the curtailment of wind energy is an increasing concern. Though a majority of wind curtailments in the U.S. are due to transmission limitations, curtailments due to excess generation during times of low net load (as happened last year in the Pacific Northwest with Bonneville Power Administration) are a significant factor that will increase if grid flexibility is not enhanced.
One measure of a flexible grid is the ability of the aggregated set of generators to rapidly change output at a high rate and over a large range. Flexibility depends on many factors, including these:
- Generator mix. Hydro and gas-fired generators are generally more flexible than coal or nuclear ones.
- Grid size. Larger grids are typically more flexible because they share a larger mix of generators and can share operating reserves and a potentially more spatially diverse set of renewable resources.
- Use of forecasting in unit commitment. Accurate forecasting of the wind and solar generation units reduces the need for operating reserves.
- Market structure. Some grids allow more rapid exchange of energy and can more efficiently balance supply from variable generators and demand.
- Other sources of grid flexibility. Some locations have access to demand response, which can provide an alternative to partially loaded thermal generators for provision of operating reserves. Other locations may have storage assets such as pumped hydro.
Increasing Solar Deployment Using CSP
An alternative to storing solar-generated electricity is storing solar thermal energy via CSP/TES. Because TES can only store energy from thermal generators such as CSP, it cannot be directly compared with other electricity storage options, which can charge from any source. However, TES provides some potential advantages for bulk energy storage, including round trip efficiency in excess of 95%.
As part of our assessment, we used a reduced form dispatch model designed to examine the general relationship between grid flexibility, variable solar and wind generation, and curtailment. We calculated the hourly electrical output of a CSP plant with 8 hours of storage.
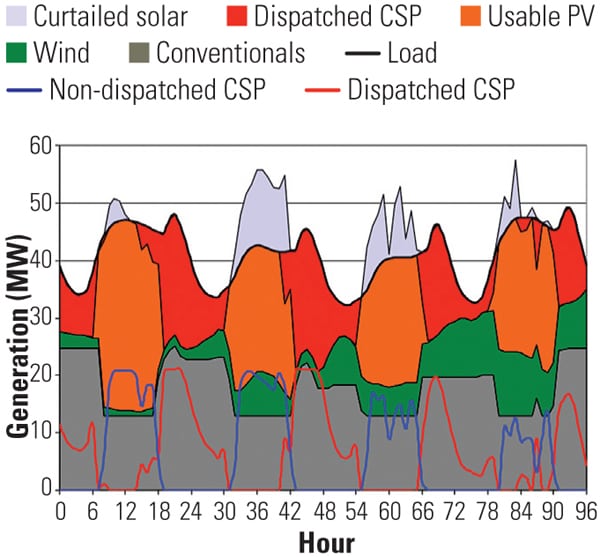
Figure 5 illustrates the importance of dispatchability at high solar penetration over a four-day period. The figure shows two CSP profiles. The “non-dispatched CSP” line (in blue) is the output of CSP alone, without thermal storage; it aligns with PV production when the sun shines, as you would expect. Without storage, the result would be significant CSP curtailment because the sum of CSP and PV generation exceeds the grid energy requirement at that time. The orange line is the actual dispatched CSP but with the effect of TES included, showing its response to the net demand pattern after wind and PV generation are considered. It shows how a large fraction of CSP energy is sent to energy storage to be shifted toward the end of the day, thus allowing the system to absorb more of the PV generation in the middle of the day. In the first day, this ability to shift energy eliminates curtailment of PV generation.
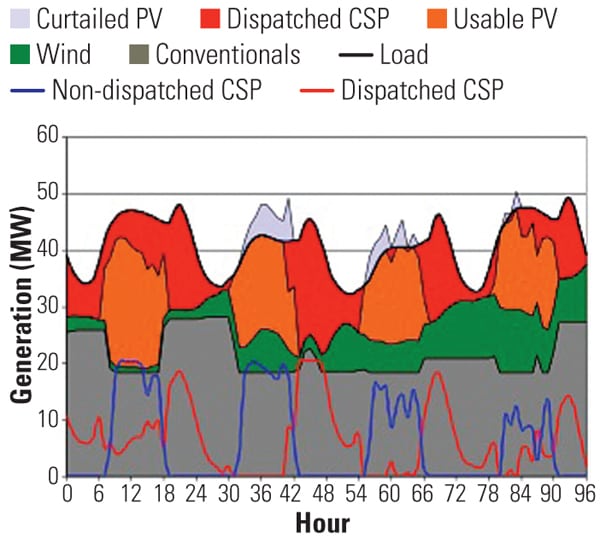 |
| 5. CSP: the dispatchable renewable energy. Simulated system dispatch is shown from April 7 to 10 with 15% contribution from PV and 10% from dispatchable CSP. This chart illustrates the importance of dispatchability at high solar penetration. The figure shows two CSP profiles. The blue line at the bottom of the chart is the non-dispatched CSP without thermal storage, which aligns well with PV generation. The red line denotes the thermal storage used to shift energy to the end of the day. Source: NREL |
On the other days, the wind and PV resources exceed the “usable” demand for energy in the early part of the day, resulting in curtailed energy even while the CSP plant is storing 100% of thermal energy. However, overall curtailment is greatly reduced.
The addition of CSP/TES can increase the overall penetration of solar by moving energy delivery to the grid from periods of low net demand in the middle of the day to morning or evening.
Figure 6 also demonstrates the importance of dispatchability to reduce curtailment and increase the overall penetration of solar via the ability to shift solar energy over time. However, the analysis to this point assumes that CSP and PV are complementary only in their ability to serve different parts of the demand pattern. We have not yet considered the additional benefits of CSP to provide system flexibility by replacing baseload generators and generators online to provide operating reserves.
 |
| 6. Achieving a good balance. This chart depicts the curtailment of solar, assuming an equal mix (on an energy basis) of PV and CSP. This demonstrates how the addition of CSP and TES can increase the overall penetration of solar by moving energy from periods of low net demand in the middle of the day to morning or evening. Source: NREL |
Adding a highly flexible generator such as CSP/TES can potentially reduce the possible generation constraints on the system. In the near term, this means that fewer conventional generators will be needed to operate at part load during periods of high solar output. In the longer term, the ability of CSP/TES to provide firm system capacity could replace retiring baseload generators.
CSP plants with TES add system flexibility because of their fast ramp rate and large operating range relative to large baseload generators. Many CSP plants, both existing and proposed, are essentially small steam (Rankine cycle) plants whose “fuel” is concentrated thermal energy. Few of these plants are deployed, so it is not possible to determine their performance with absolute certainty. However, historical performance of the SEGS VI power plant located in Kramer Junction, Calif., and small gas-fired steam plants provides some indication of CSP flexibility. These plants operate at well over a 50% capacity range with only about a 5% increase in heat rate at 50% load. This provides a strong indication that CSP plants should be able to provide high flexibility.
Implementing a flexible grid, as described above, with solar thermal and PV plants requires CSP plants that are more flexible in operation than conventional fossil-fueled plants. Because it is not possible to determine the exact mix of generators that would be replaced in high renewables scenarios, we consider a range of possible changes in the minimum generation constraints resulting from CSP deployment.
CSP flexibility is defined as the fraction of the CSP-rated capacity that is assumed to reduce the system’s potential generation constraint. For example, deployment of a CSP plant with TES that can operate over 75% of its capacity range could replace a baseload plant that normally operates over 50% of its range. In this scenario, each unit of CSP could reduce the minimum generation constraint by 25% of the plant’s capacity.
This very simplistic assumption illustrates how the dispatchability of a CSP plant could allow for a lower minimum generation limit and allow for greater use of wind and PV. As a result, as CSP is added, the grid can actually accommodate more PV than in a system without CSP.
This is illustrated conceptually in Figure 7, which also shows a four-day period. CSP still provides 10% of the system’s annual energy, but now we assume that the use of CSP allows for a decreased minimum generation point, and the decrease is equal to 25% of the installed CSP capacity. In this case about 21 GW of CSP reduces the minimum generation point from about 18 GW to 13 GW. This generation “headroom” allows for greater use of PV, and enough PV has been added to meet 25% of demand (up from 15% in Figure 5). As a result, the total solar contribution is now 35% of demand. By shifting energy over time and increasing grid flexibility, CSP/TES enables greater overall solar penetration and greater penetration of PV.
 |
| 7. CSP boosts PV penetration. Simulated system dispatch from April 10 to 13 is shown with 25% contribution from PV and 10% from dispatchable CSP, where CSP reduces the minimum generation constraint. By shifting energy over time and increasing grid flexibility, CSP enables greater overall solar penetration and, in particular, greater penetration of PV. Source: NREL |
The potential overall impact of the flexibility introduced by CSP/TES and the corresponding opportunities for increased use of PV are shown in Figure 8, which builds on Figure 6 by adding the energy supplied by CSP/TES. The figure assumes that each MW of capacity of CSP energy reduces the minimum generation constraint by 25% of its capacity, and an equal mix of PV and CSP/TES on an energy basis. In this case, the addition of CSP/TES allows PV to provide 25% of the system’s energy with very low levels of curtailment.
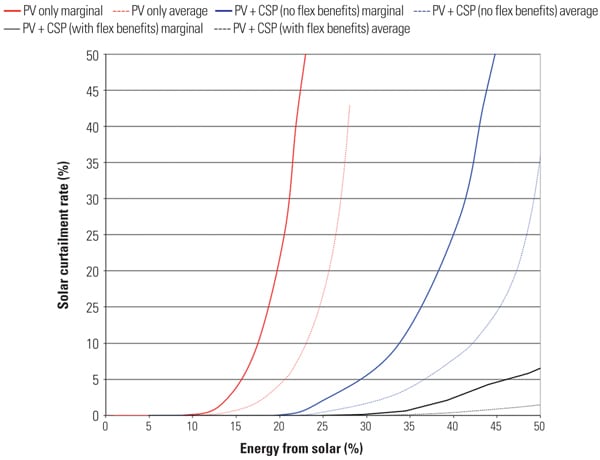 |
| 8. The power of grid flexibility. The curtailment of solar is shown, assuming an equal mix (on an energy basis) of PV and CSP. The chart illustrates the potential overall effect of grid flexibility introduced by CSP and the corresponding opportunities for increased use of PV. Source: NREL |
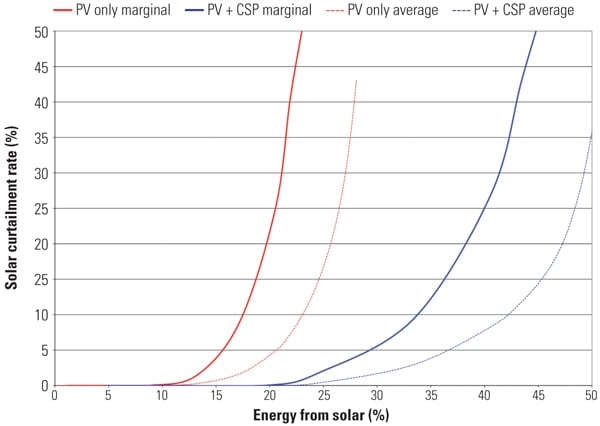
The relationship between the reduction in minimum generation constraint and potential increase in PV penetration is illustrated in Figure 9, which shows how much more PV could be incorporated at a constant marginal curtailment rate of 20% when CSP is added. In this scenario, the x-axis represents the fraction of annual system energy provided by CSP. Increased penetration of CSP results in a linear decrease in minimum generation constraints. The figure illustrates two CSP flexibility cases. In one scenario, each unit of CSP reduces the minimum generation constraint by 20% of its capacity; in the other, the CSP flexibility is assumed to be 40%. These amounts are not meant to be definitive but represent a possible impact of CSP in reducing minimum generation constraints.
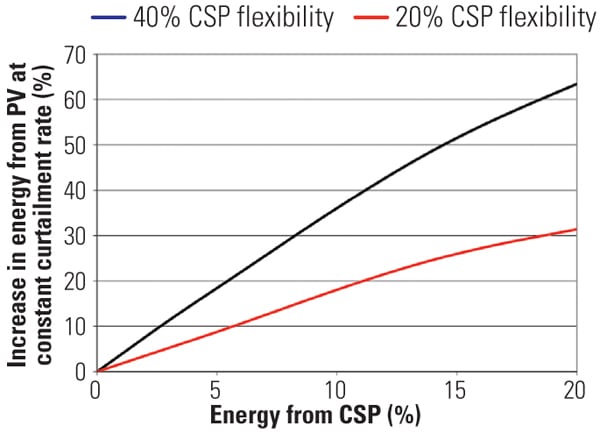 |
| 9. A dynamic duo. The figure shows the relationship between reducing generation constraints through the addition of CSP/TES and the potential increase in PV penetration. CSP flexibility is defined as the fraction of the CSP rated capacity that is assumed to reduce the system’s minimum generation constraint. Source: NREL |
Further Quantifying the Benefits of CSP Deployment
This analysis is a preliminary assessment of the potential benefits of CSP in providing grid flexibility using reduced form simulations with limited geographical scope and many simplifying assumptions. Gaining a more thorough understanding of how CSP can enable greater PV and wind penetration will require detailed production simulations using security-constrained unit commitment and economic dispatch models currently used by utilities and system operators.
Future and ongoing studies at NREL and elsewhere will evaluate the benefits of TES in more detail. To perform these simulations, production cost models will need to include the ability of CSP to optimally dispatch the solar energy resource. These simulations will consider the operation of the entire power plant fleet, including individual generator characteristics and constraints, and the operation of the transmission system. These simulations will provide a better estimate of the benefits of grid flexibility enables by CSP deploying TES.
— Paul Denholm, PhD (paul.denholm@nrel.gov), a senior analyst, and Mark Mehos (mark.mehos@nrel.gov), a principal program manager, work at the National Renewable Energy Laboratory. This article is based on an abridged version of the report titled “Enabling Greater Penetration of Solar Power via the Use of CSP with Thermal Energy Storage.” The full report (Technical Report NREL/TP-6A20-52978) is available electronically at no cost at http://www.osti.gov/bridge.