Inspection and monitoring of underwater structures has always been a challenge for power plants with submerged cooling system structures, mainly due to those structures’ inherent inaccessibility. Commercial divers and remotely operated vehicles (ROVs) work well for inspecting specific areas, but it’s hard to assemble the point measurements that they make into a big picture of an asset’s health.
High-flow conditions further complicate the task. Turbulence often dictates shutting down not only the generating unit being inspected but also units with adjacent intake structures and pumping stations. As a result, manual inspection methods incur three different kinds of costs: lost generation sales, the labor costs of the inspection itself, and the time costs of completing the regulatory paperwork and performing the administrative procedures needed to shut down and restart one or more units following the inspection.
Naturally, inspections of underwater structures may be done manually on a routine basis, and only during planned outages. But where more frequent inspection is warranted, any noninvasive technique able to examine structures under full operational load would provide more-useful data at a great cost savings. Scanning sonar is one such technique.
Easy as XYZ
Any sonar system transmits a pulse of sound and measures the time it takes to receive an echo from a target. Multiply this time by the speed of sound in the medium, and you know the distance to the target. Scanning sonar systems repeat this pulse-echo process several times as the transducer head is rotated through preset increments, effectively scanning a line.
Scanning sonar can work in either imaging or profile mode. In the former case, the images delivered can be used to make subjective assessments of the integrity and fouling of bridge piers, cooling water intakes, and dam walls (Figure 1). But because the images are two-dimensional, they cannot be used to identify the location of debris or damage in the third dimension, or its extent. In order to quantify the volume of debris or the extent of scour, measurements must incorporate survey points that are known in three dimensions so that volumetric calculations can be made.
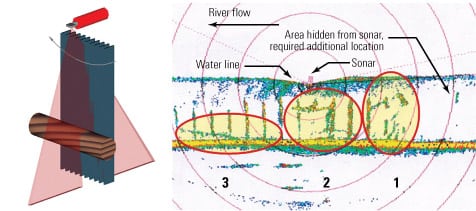
1. Scanning sonar in imaging mode. This mosaic was made from imaging scans showing possible debris locations. The extent of the debris in the third dimension (toward and away from the viewer) cannot be determined from this type of survey. Source: ASI Group Ltd.
A scanning sonar system configured for profiling instead of imaging (Figure 2) can obtain the third set of coordinates, producing something akin to a relief map. Setting up the sonar at several locations enables collection of enough survey points to cover the desired area. If the process is properly done, it takes much longer to do the setups than the scans.
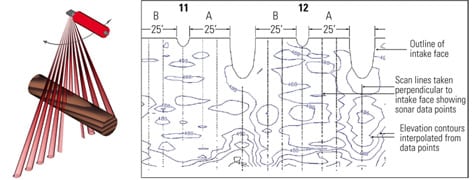
2. Scanning sonar in profiling mode. A bathymetric plot made by interpolating several profiling scans perpendicular to the intake face. Enough scans at different locations were done to provide 1,200 data points. Source: ASI Group Ltd.
A big benefit of using dual-axis scanning sonar is that it allows the position of the scanning head to be fixed at one or more known locations. Realize that if the head moves due to vibration or an insecure mount, the resulting measurements will be skewed unless they are extensively post-processed to correct for the positional errors. Well-designed dual-axis scanning sonar systems calibrate the readings to assist with post-processing by incorporating attitude sensors for measuring pitch, roll, and possibly yaw or heading.
Dual-axis scanning sonar systems such as the one whose work is shown in Figure 3 also include a precision actuator. The system’s primary axis is the one around which the transducer rotates. The secondary axis, provided by the actuator, is used to rotate the body of the sonar perpendicular to the primary axis. With the head rotation on both axes known, the location of the point (return echo) can be determined in Cartesian coordinates. Making multiple scans from different angles allows generation of "point cloud" representations.
The system’s on-board attitude sensors enable correlation of measurements to the actual mounting angle of the scanning head. Based on feedback from the sensors, the scanning process can be halted if the system moves due to vibration and then be restarted after it stabilizes. Calculations of the speed of sound can be made more accurate by optional water depth, temperature, and conductivity sensors.
Proven in practice
Following are lessons learned from, and general details of, three deployments of an ASI Group Ltd. dual-axis scanning sonar system for condition assessment that did not require a unit or plant shutdown.
Intake structure. Dual-axis sonar is ideal for monitoring the buildup of debris in and around an intake structure. Using multiple setups, it is possible to generate a point cloud representation of an entire intake face and the surrounding bathymetry without shutting a unit down. The extent and location of debris buildup can be determined accurately and viewed as the scan is taking place. When multiple scans are performed across an intake face, the point clouds can be merged by finding common points in adjacent scans and interlacing the data sets. Generating and trending point cloud representations of an intake structure at scheduled intervals can help determine when a unit should be shut down to remove debris clogging its cooling water intake.
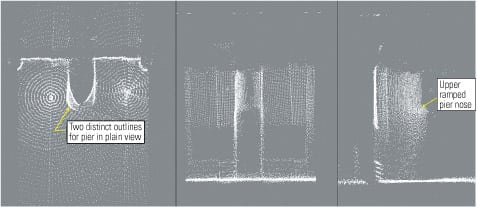
Because sonar scans made by the ASI system are made along two axes, more details of submerged components perpendicular to the structure also are recorded. That was not the case for the initial, profiling scan of an intake structure shown in Figure 2; because the lines never reached the pier noses, their details were not captured. In the subsequent dual-axis survey (Figure 3), the scans were not only perpendicular to the face of the intake, but they also were made at roughly 3-degree increments over 180 degrees to intersect the pier noses. Details of the stepped pier noses are clearly visible, confirming as-built information that was previously in dispute. Figure 4 is a side-by-side-side representation of the three-dimensional data produced by the ASI system.

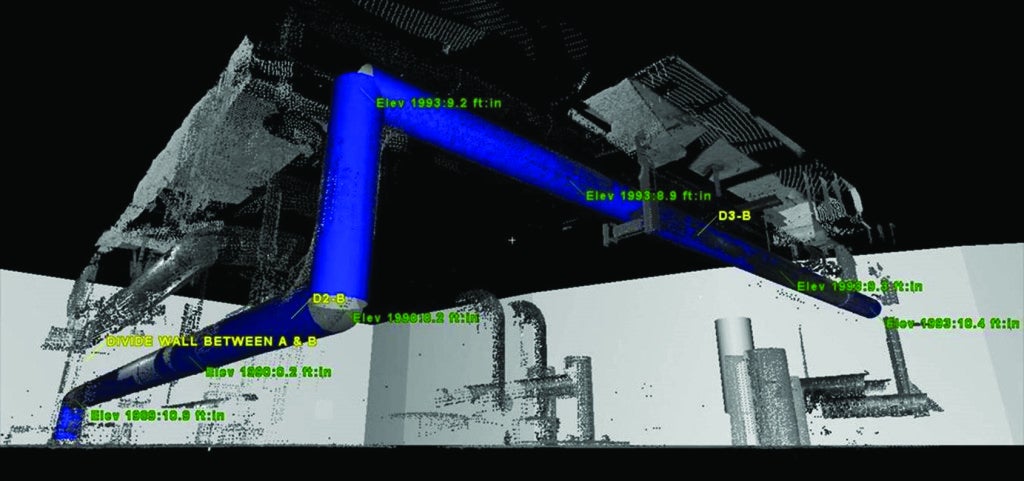
3. Richer perspective. Here’s the same survey area shown in Figure 2 as pictured (without the contour lines) by a scanning sonar operating in dual-axis mode. Only four system setups were needed to generate more than 15,000 data points, which reveal more detail of pier noses than conventional perpendicular scans. Source: ASI Group Ltd.
4. Deeper understanding. A representation of the scanning sonar’s 3-D data set showing intake openings and pier details. Source: ASI Group Ltd.
Surge shaft. The first deployment of ASI’s dual-axis system was for the survey of a 600-foot vertical surge shaft submerged in 500 ft of water. The customer wanted to determine the verticality of the shaft and the smallest clear vertical opening into which a steel liner could be installed.
The initial plan was to perform several horizontal scans using a profiling sonar system, but the client was concerned that even with a vertical resolution of 1.5 ft, some details might be missed. Conducting another series of short vertical scans around the circumference may have been able to capture the missing details in the radial direction, but this would have been very time consuming. In the end, ASI proposed a more elegant way to scan in the vertical and radial directions at the same time: by mounting the system at a 45-degree angle, rather than horizontally (Figure 5). As a consequence, the shaft was surveyed in diagonal slices of elliptical shape.

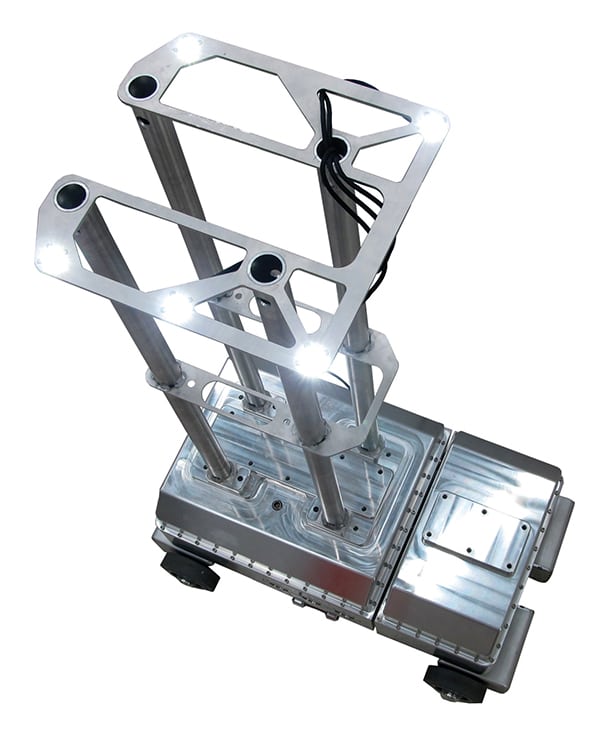
5. Double duty. Here the scanning sonar head is mounted at a 45-degree angle on a secondary stepper motor. Courtesy: ASI Group Ltd.
After trying out several scan patterns, the system was configured to gather data with a scan resolution of 6 inches in the radial direction and 12 inches in the vertical direction. Once a scan was completed, the head was rotated a fixed amount and another scan was begun. A full set of these scans covered roughly 12 ft of height. Then the sonar head was lowered 10 ft and another set of scans was initiated. The 1-ft overlap between scan sets produced a very dense point cloud, which significantly reduced the chance of missing a defect.
The shaft survey was completed in less than three days, well within the customer’s maintenance outage window of 10 days. The upper portion of the shaft and the surrounding surge tank were scanned by a high-resolution, close-range laser unit (Figure 6). Data from the laser were processed and merged with the sonar data to create a comprehensive data set for the overall shaft. Four temporary benchmarks, set into the floor of the surge tank, were also surveyed and combined with the data set. They can subsequently be related to geodetic survey points at the client’s convenience for integration with the known benchmarks.

6. Multimedia show. These are the laser scanner and targets used for the topside survey. The framework over the shaft was used to support the dual-axis sonar survey. Courtesy: ASI Group Ltd.
The results of the two surveys provided definitive metrics that were used to determine the largest clear shaft opening. The data set also identified an offset in the existing shaft concrete lining—which, coincidentally, fell within the overlap area of two scan sets. The duplication of the offset in both data sets verified that it is a true feature. Another construction feature revealed by the survey: Below a certain point, the shaft diameter increased by 6 inches.
Although this survey target was vertical, inclined penstocks and horizontal tunnels are just as amenable to scanning sonar inspection. The orientation of the structure does not affect the viability or accuracy of data collection or processing.
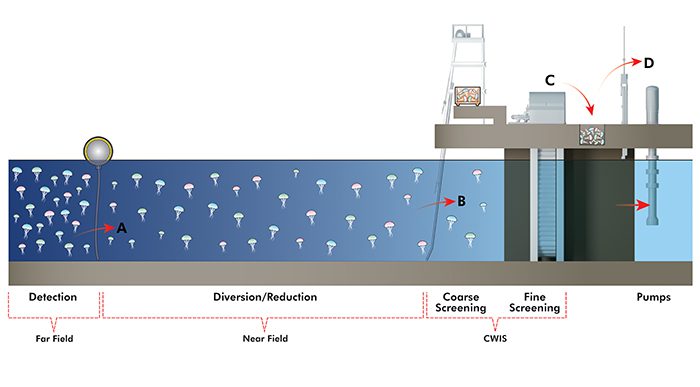
Forebay sediment monitoring. Intake structures are only the first link in a long and complex plant water-supply chain. It’s also important to regularly inspect the other "out of sight, out of mind" assets in this system—headrace tunnels, intake channels, forebays, wet wells, discharge channels, tunnels, and pipelines. By monitoring the buildup of sediment in and on these structures at several points, a dual-axis scanning sonar system can optimize their cleaning and maintenance schedules (Figures 7 and 8).

7. Get the picture? In this representation from an imaging scanning sonar survey of a submerged intake structure, pier noses, trash racks, and debris accumulation can clearly be seen. Source: ASI Group Ltd.
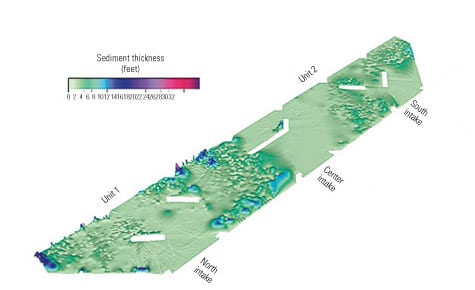
8. Relief map. This isometric view of a sediment map was produced by a survey of a pump well forebay. Deflector walls and piers are outlined on the plot. Source: ASI Group Ltd.
A cautionary note: The setup of the sonar system must take into account the layout of the structure to be inspected. Like a beam of light, the sonar’s acoustic pulse cannot "see" around corners or through dividing walls, piers, or columns. To effectively plan and conduct a survey, be sure that the inspection team uses accurate drawings for reference to determine the best locations for providing the desired spatial coverage. For an enclosed structure under a plant floor, it may be necessary to cut one or more holes in the floor to deploy the sonar system. The holes could then serve as personnel access points to facilitate future maintenance.
Determining the extent and location of sediment deposits and debris accumulation has been the primary objective of most of ASI’s dual-axis surveys. But such surveys can show the extent and location of scour and erosion equally well. Scanning surveys have proven most effective when their results can be compared with baseline data from previous surveys to reveal troublesome trends.
Evolutionary and revolutionary
New technologies are often developed with the intention of replacing or improving on existing methods. But some make it possible to perform tasks that had not been feasible or practical. Advanced, dual-axis scanning sonar systems represent both types of innovation. They can speed up, simplify, and lower the cost of underwater inspections, and they enable real-time monitoring of sediment accumulation—something previously impossible. Deploying a dual-axis system is certainly worth considering at any facility with a history of intake clogging.
Scanning sonar also makes sense for any plant whose water source is having its bed altered by a construction project. Although it takes several minutes to complete a scan, this rate of data collection may be acceptable for monitoring a drilling or dredging operation. Using a dual-axis system, it would be possible to observe any collapse or undercutting taking place and take corrective action in time to prevent problems.
—Robert Clarke is senior operations manager, Marine Services Group, and Jason Gillham is ROV technician of ASI Group Ltd. (www.asi-group.com), based in St. Catharines, Ontario. Clarke can be reached at (905) 641-0941 ext 241 or bclarke@asi-group.com.