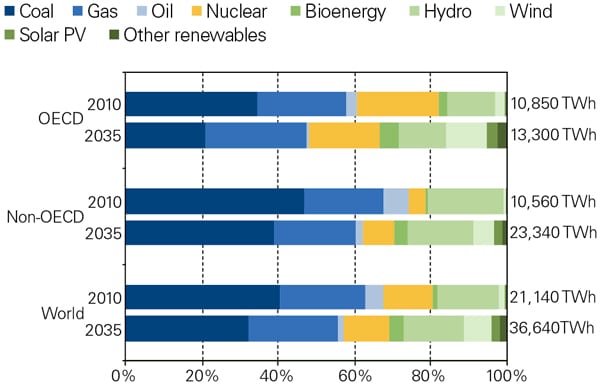
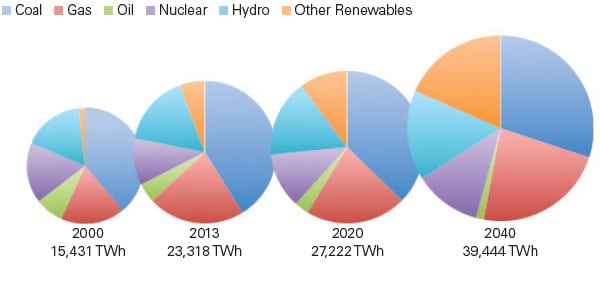
Driven by policies to limit carbon emissions, as well as government subsidies, the share of worldwide nonhydro renewable power is set to grow from just 3% in 2009 to 15% in 2035, the International Energy Agency (IEA) forecasts in its recently released World Energy Outlook 2011. Under the same scenario—which assumes that carbon pricing, explicit or implicit, is adopted in developed countries as well as China—coal will continue to reign as the world’s largest source of power globally in 2035, but to a much lesser extent, falling from 41% to 33% (Figure 1). Power from oil will become a rarity, as it drops from 5% in 2009 to 1.5% in 2035, and the percentage of power from natural gas, hydro, and nuclear will remain relatively constant throughout the period, at 22%, 16%, and 13% respectively, the report says.
 |
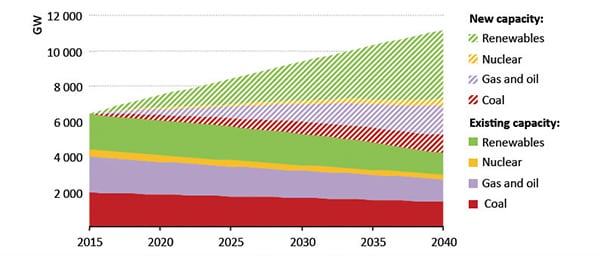
| 1. Policies prime renewable pump. According the International Energy Agency’s (IEA’s) World Energy Outlook 2011‚ the share of renewables in global installed power generation capacity and additions in the New Policies Scenario is poised to surge to 15% in 2035, from 3% in 2009. Courtesy: IEA |
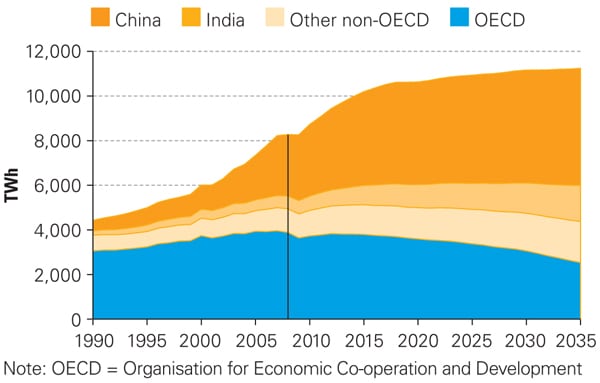
Demand for power is forecast to continue its upward trend, even though in 2009 demand fell by an unprecedented 0.7% in response to the global economic slowdown. In the New Policies Scenario, which assumes carbon pricing in only developed countries and China, demand will grow by four-fifths, at 2.4% to over 31,700 TWh in 2035. If current policies are continued, as assumed in the Current Policies scenario, demand will double, and under the 450 Scenario, which assumes carbon policies are implemented in every country, it will increase by almost two-thirds. Nearly 80% of demand growth will occur in developing countries, with China and India representing two-thirds of that growth. Industry will remain the largest power-consuming sector, with residential use following close behind. Even with widespread use of electric vehicles, as is envisioned by 2035, transportation will only account for about 2% of total demand.
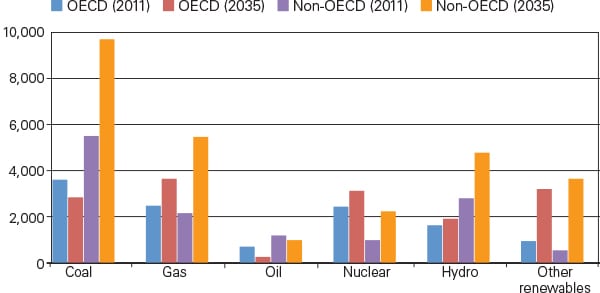
Coal power will double in developing countries—far outweighing a fall in developed countries, particularly in the European Union (EU), where it plunges by two-thirds as a result of the EU’s carbon emissions trading program. (See “The Big Picture” on p. 12 for more on carbon taxes.) In the U.S., even under the New Policies Scenario, coal will remain comparatively stable, dropping just 3% between 2009 and 2035. China’s share of coal power is also expected to drop from 79% in 2009 to 56% in 2020, but in India, coal use is projected to almost triple.
The IEA projects that more-efficient coal-fired plants will be built through 2035, including ultrasupercritical designs and integrated gasification combined cycle plants, driven by increases in coal prices and reductions in the capital costs of advanced coal technologies. “As a result, the average global thermal efficiency of coal plants increases by four percentage points, from 38% in 2009 to 42% in 2035,” the report says. By 2035, 65 GW of coal capacity will be equipped with carbon capture and storage, though related technologies only become competitive with other generation technologies closer to 2035, and only in regions that have adopted a carbon price.
Natural gas–fired generation will grow from 4,300 TWh in 2009 to a little over 7,900 TWh in 2035 under the New Policies Scenario, with much of that growth occurring in China (one-fifth), the Middle East (one-fifth), and India (one-tenth). Gas generation will also grow in developed countries, spurred by efficiency improvements and carbon pricing that will make gas power competitive with coal. Combined cycle gas turbines (CCGT) will remain the dominant gas-fired generation technology (over 60% of growth in gas-fired generation will be produced by CCGT plants), but use of open-cycle gas turbines is also forecast to more than double.
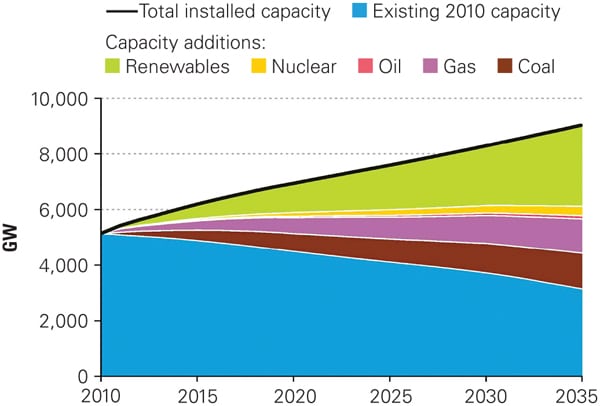
The nuclear accident in Japan resulted in retirement plans for all nuclear plants in Germany by the end of 2022, no lifetime extensions or new plants in Switzerland, decommissioning of Units 1 to 4 and no construction of new units at the Fukushima Daiichi site, and delays in capacity additions in China. In the wake of the Japanese disaster, financing may become more difficult to secure for nuclear projects worldwide, leading to an increased cost of capital, the IEA forecasts. Compared to figures published in the 2010 Outlook, expected construction costs have risen by 5% to 10%. Even so, many countries will press ahead with plans for new nuclear, though short-term delays are expected. Globally, nuclear power capacity is projected to rise in the New Policies Scenario from 393 GW in 2009 to 630 GW in 2035—just some 20 GW lower than projected in the previous year’s Outlook.
Renewables expand significantly in all three scenarios—and especially in the New Policies Scenario, where they triple, from 3,900 TWh in 2009 to 11,100 TWh in 2035, driven by government policies, including subsidies (Figure 2). The bulk of this growth comes from wind and hydro (about 33% each); biomass accounts for about 17% and solar photovoltaic (PV) for about 10% of all renewable generation.
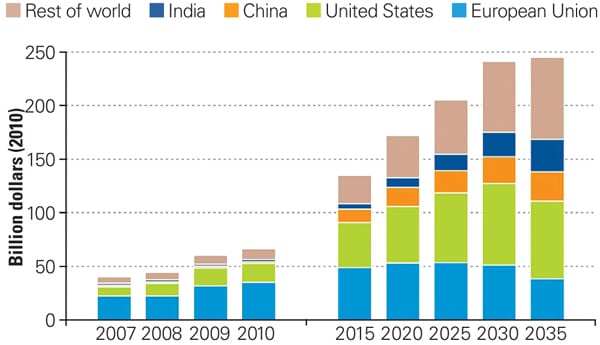 |
| 2. Continued support. Global subsidies to renewables-based electricity and biofuels by region in the New Policies Scenario are set to increase, with renewable subsidies increasing from $66 billion in 2010 (compared with $409 billion for fossil fuels) to $250 billion in 2035, the International Energy Agency says. Courtesy: IEA |
The U.S., China, EU, and India will see the most wind growth (almost 75%) and about 70% of solar PV growth. Ultimately, China will be the world’s leading onshore wind power producer. The IEA suggests that solar PV is also set to grow tremendously, at a rate of 15% per year until 2035. The EU currently accounts for about 75% of global solar PV generation. Europe will continue to see strong growth over the next few years, but between 2020 and 2035, the increases in solar PV generation in China, the U.S., and India will each be larger than in the EU.
Hydropower has already been developed extensively in many developing countries, and there “is limited remaining potential, given the costs and environmental constraints,” the report says. Developing countries will see 85% of new hydro capacity additions, with China, India, and Brazil making more than half of those additions. Biomass power plants grow at an average annual rate of 6.5%, which results in a five-fold growth in output over the Outlook period, from 288 TWh in 2009 to 1,500 TWh in 2035. Again, the bulk of that growth will come from developing countries, with China and India leading the pack.
—Sonal Patel is POWER’s senior writer.