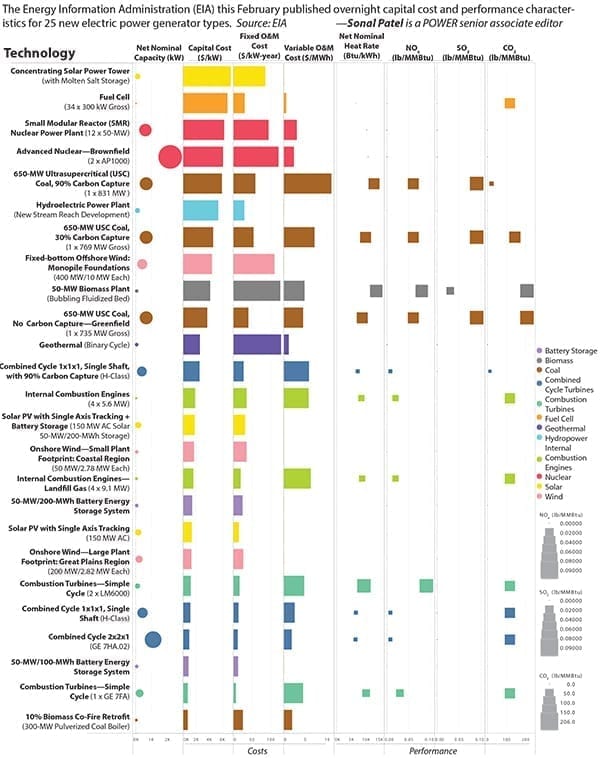
The Energy Information Administration (EIA) in February 2020 published capital costs and performance characteristic estimates for 25 new electric power generating technologies. These estimates come from global engineering and design firm Sargent & Lundy (S&L), which the EIA commissioned to help accurately reflect the changing cost of new power generation technologies for the Annual Energy Outlook 2020.
According to S&L, the estimates are developed based on information about similar facilities recently built or are under development in the U.S. and abroad. “Developing the characteristics of each generating technology included the specification of representative plant sizes, configurations, major equipment, and emission controls. Sargent & Lundy’s cost assessment included the estimation of overnight capital costs, construction lead times, and contingencies as well as fixed and variable operating costs,” it said. S&L also reviewed recent market trends for the reference technologies and its extensive background in power plant design and experience in performing similar cost and performance assessments. A more detailed explanation is available in its report.
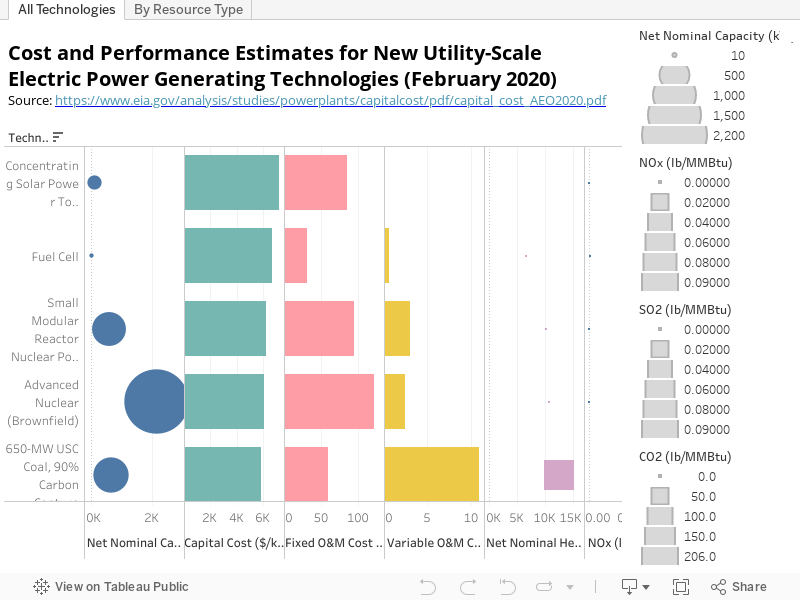
Interactive Graphic
View the interactive version of this month’s infographic on Tableau Public here.
How Costs Compare by Fuel Type

In This Issue
Full issueThe Data Table
| Technology | Description | Net Nominal Capacity (kW) | Net Nominal Heat Rate (Btu/Kwh) | Capital Cost ($/kW) | Fixed O&M Cost ($/kW-year) |
Variable O&M Cost ($/MWh) | NOx (lb/MMBtu) | SO2 (lb/MMBtu) | CO2 (lb/MMBtu)) |
| 650-MW USC Coal without Carbon Capture—Greenfield | 1 x 735 MW Gross | 650 | 8638 | 3676 | 40.58 | 4.50 | 0.06 | 0.09 | 206 |
| 650-MW USC Coal, 30% Carbon Capture | 1 x 769 MW Gross | 650 | 9751 | 4558 | 54.30 | 7.08 | 0.06 | 0.09 | 144 |
| 650-MW USC Coal, 90% Carbon Capture | 1 x 831 MW Gross | 650 | 12507 | 5876 | 59.54 | 10.98 | 0.06 | 0.09 | 20.6 |
| Internal Combustion Engines | 4 x 5.6 MW | 21 | 8295 | 1810 | 35.16 | 5.69 | 0.02 | 0 | 117 |
| Combustion Turbines—Simple Cycle (2 x LM6000) | 2 x LM6000 | 105 | 9124 | 1175 | 16.30 | 4.7 | 0.09 | 0.00 | 117 |
| Combustion Turbines—Simple Cycle (1 x GW7FA) | 1 x GE 7FA | 237 | 9905 | 713 | 7.00 | 4.5 | 0.03 | 0.00 | 117 |
| Combined-Cycle 2x2x1, No Carbon Capture | GE 7HA.02 | 1083 | 6370 | 958 | 12.20 | 1.87 | 0.0075 | 0.00 | 117 |
| Combined-Cycle 1x1x1, Single Shaft, No Carbon Capture | H Class | 418 | 6431 | 1084 | 14.1 | 2.55 | 0.0075 | 0.00 | 117 |
| Combined-Cycle 1x1x1, Single Shaft, with 90% Carbon Capture |
H-Class | 377 | 7124 | 2481 | 27.6 | 5.84 | 0.0075 | 0.00 | 11.7 |
| Fuel Cell | 34 x 300 kW Gross | 10 | 6469 | 6700 | 30.78 | 0.59 | 0.0002 | 0 | 117 |
| Advanced Nuclear (Brownfield) | 2 x AP1000 | 2156 | 10608 | 6041 | 121.64 | 2.37 | 0 | 0 | 0 |
| Small Modular Reactor Nuclear Power Plant | 12 x 50-MW Small Modular Reactor | 600 | 10046 | 6191 | 95.00 | 3.00 | 0 | 0 | 0 |
| 50-MW Biomass Plant | Bubbling Fluidized Bed | 50 | 13300 | 4097 | 125.72 | 4.83 | 0.08 | 0.03 | 206 |
| 10% Biomass Co-Fire Retrofit | 300-MW PC Boiler | 30 | +1.5% | 705 | 25.57 | 1.90 | |||
| Geothermal | Binary Cycle | 50 | N/A | 2521 | 128.544 | 1.16 | 0 | 0 | 0 |
| Internal Combustion Engines—Landfill Gas | 4 x 9.1 MW | 35.6 | 8513 | 1563 | 20.1 | 6.2 | 0.02 | 0 | 117 |
| Hydroelectric Power Plant | New Stream Reach Development | 100 | N/A | 5316 | 29.86 | 0 | 0 | 0 | 0 |
| 200-MWh Battery Energy Storage System | 50 MW | 200 MWh | 50 | N/A | 1389 | 24.8 | 0 | 0 | 0 | 0 |
| 100-MWh Battery Energy Storage System | 50 MW | 100 MWh | 50 | N/A | 845 | 12.9 | 0 | 0 | 0 | 0 |
| Onshore Wind—Large Plant Footprint: Great Plains Region | 200 MW | 2.82 MW WTG | 200 | N/A | 1265 | 26.34 | 0 | 0 | 0 | 0 |
| Onshore Wind—Small Plant Footprint: Coastal Region | 50 MW | 2.78 MW WTG | 50 | N/A | 1677 | 35.14 | 0 | 0 | 0 | 0 |
| Fixed-bottom Offshore Wind: Monopile Foundations | 400 MW | 10 MW WTG | 400 | N/A | 4375 | 110 | 0 | 0 | 0 | 0 |
| Concentrating Solar Power Tower | with Molten Salt Thermal Storage | 115 | N/A | 7221 | 85.4 | 0 | 0 | 0 | 0 |
| Solar PV w/ Single Axis Tracking | 150 MWAC | 150 | N/A | 1313 | 15.25 | 0 | 0 | 0 | 0 |
| Solar PV with Single Axis Tracking + Battery Storage |
150 MWAC Solar 50 MW | 200 MWh Storage |
150 | N/A | 1755 | 31.27 | 0 | 0 | 0 | 0 |
Source: Capital Cost and Performance Characteristic Estimates for Utility Scale Electric Power Generating Technologies, EIA, February 2020. —Sonal Patel is a POWER senior associate editor (@sonalcpatel, @POWERmagazine).