Gencos selling into the wholesale market in Texas are no longer primarily responsible for the reliability of supply. In that deregulated market, responsibility for reliability has been largely transferred to the Electric Reliability Council of Texas (ERCOT), an independent system operator regulated by the state Public Utility Commission. Gencos are, however, given financial incentives to provide services and products to the market, and they respond to these incentives in the same way that they respond to a need to maintain a reserve margin or another reliability-related parameter. One of the incentives is ERCOT’s award of daily contracts to plants to quickly ramp up or down in response to overall system demand.
The amount and type of power supply capacity in ERCOT has changed dramatically over the past eight years for two main reasons: deregulation and the commissioning of over 20,000 MW of high-efficiency, natural gas–fired combined-cycle plants. Power producers responded to these two events by mothballing or decommissioning around 10,000 MW of older gas-fired steam plants whose marginal operating costs could not compete with those of the combined-cycle plants. Every owner of an older gas-fired steam plant had to decide whether to throw in the towel or find something other than capacity that the plant could sell profitably.
Adding support to supply
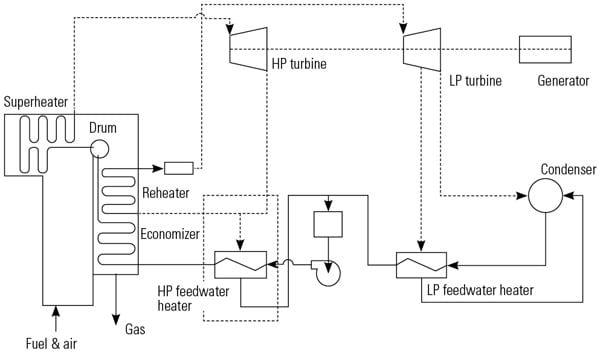
Lower Colorado River Authority (LCRA) began operating the first 150-MW unit of the Sim Gideon Power Plant (see cover photo) in 1965. Another 150-MW unit was commissioned in 1968, and a third, rated at 350 MW, went commercial in 1972. The old plant shares its site with the Lost Pines 1 Power Project, a gas-fired combined-cycle plant that came on-line in May 2001 (Figure 1). At the time, Lost Pines was owned by GenTex Power Corp., a nonprofit subsidiary of LCRA. In 2006, when the facility became wholly owned by LCRA, it was renamed the Lost Pines Power Park and the staffs of both plants were combined.
1. Shared site and staff. The Lost Pines Power Park includes the three gas-fired steam units of the Sim Gideon Power Plant (shown on the cover) and the six-year-old Lost Pines Power Project combined-cycle plant shown here. A single plant staff operates both facilities. Courtesy: LCRA
LCRA had long been proactive about upgrading the Sim Gideon plant’s controls, but the opportunity to sell ancillary services provided an additional incentive for investment. Any plant owner willing to spend a little to configure his asset to operate in load-following mode may be richly rewarded. LCRA realized this, and its modest investment in Sim Gideon has given the 42-year-old facility a new mission: to be a strong competitor in ERCOT’s ancillary services niche market while continuing to supply reliable, low-cost power to the utility’s customers in central Texas.
In the ancillary services market, generators are paid to provide load regulation services. The market places a high value on a plant’s ability to change load rapidly. For example, a genco wishing to provide load regulation services to ERCOT will bid, on a day-ahead basis, how much he requires to be paid to provide a fixed megawatt change over any 10-minute period. ERCOT will award a contract to the low bidder and pay his bid price whether the ramping capability is called for or not.
When the Sim Gideon plant began its life in 1970, it was hardly the nimble operator it is today. Over the years, it was retrofitted with state-of-the-art distributed controls and, more recently, with a plant optimization system capable of maximizing unit ramp rate—the Holy Grail of ancillary services provision. A new set of operational challenges arose with the shift in plant operation from baseload mode to load-following mode and unit cycling. One of those challenges was to optimize unit ramp rate while minimizing the negative impact on steam turbine longevity of rotor bore stresses caused by rapid metal temperature excursions.
Old dog learns new tricks
The first target of the Sim Gideon controls upgrade project was the 350-MW Unit 3, which is powered by a tangentially fired, single-furnace boiler from Combustion Engineering and a D-8 steam turbine from General Electric. During this phase of the project, engineers used an advanced control software tool to interface to the unit’s existing I/A control system from Foxboro (www.foxboro.com). The hookup had two objectives: 1) to improve the unit’s heat rate and reduce its NOx emissions without increasing its CO2 emissions and 2) to reconfigure the unit for rapid load-following service.
In 1995, Unit 3’s original analog boiler controls and GE Mark I turbine controls were replaced by a Foxboro IA distributed control system—serial No. 1 installed on a large steam turbine. Along with the boiler and turbine controls, burner management and controls, data acquisition, motor controls, and all remaining balance-of-plant equipment were brought under the IA umbrella. The return on this investment was better control over a wider load range at higher ramp rates than was possible with the analog system. The IA system increased controllable ramp rates, both in MW/min and the allowable control range.
For example, the range for area control had been 120 MW to 290 MW, with manual operator control above and below those values. The new controllable range with the digital controls was safely set at 60 MW to 340 MW. In addition to the 110-MW expansion of load range, automatic generation control (AGC) could now be set at 40 MW/min across a large portion of the range. In 1998, a neural net–based process optimization modeling system (POMS) was interfaced with the IA system to provide NOx reduction, lower heat rates, and advanced control features such as induced flue gas recirculation (IFGR).
In IFGR, a damper regulates the amount of flue gas recirculated to the inlet duct of the forced-draft (FD) fan. For maximum NOx reduction, the amount recirculated is maximized. However, at higher unit loads the amount must be reduced to keep the power consumption of the FD fan motor below its allowable limit. The control problem is to maintain the amount of gas recirculated near its highest level without burning out the FD fan motor.
On Sim Gideon Unit 3, the benefits of the POMS retrofit—a heat rate reduction of 0.34%, an 8% cut in NOx emissions, and a CO2 reduction of 3.4%—were so significant that the project paid for itself in just six months. A subsequent upgrade of the unit’s controls, in 2002, produced a further reduction in NOx emissions of nearly 25% and a heat rate improvement of 0.65%. Like the first project, this one was conceived and executed by a team of Invensys Foxboro employees and LCRA staffers at Sim Gideon Power Plant.
Since deregulation, ERCOT—rather than LCRA—has decided which units at Sim Gideon are dispatched, and at what capacity, to meet statewide system demands. In 2002, to better accommodate the emerging ERCOT markets and to make itself more competitive, LCRA implemented a new strategic efficiency plan for Sim Gideon Unit 3. The plan called for the implementation of a new energy management system to change the drivers of the AGC system from pulses to setpoints, essentially placing the unit under local operator control.
Stressed-out rotor
The first grid-induced test of the upgraded controls occurred in April 2004, when ERCOT mistakenly dispatched Sim Gideon Unit 3 to catch a large load change that should have been allocated across several units. Unit 3 was ramped up and down between 60 MW and 320 MW several times. Each cycle took from 7 to 9 minutes to complete, and the average rate of load change was 35 MW/min.
The Foxboro control system held all controllable variables within acceptable limits during this AGC roller-coaster ride. The increased ramp rate appeared not to adversely affect control of drum level, superheater and reheater outlet temperatures, boiler master, airflow, or automated burners. All processes seemed to work in unison, doing their part to maximize unit ramp rate. Although the unit responded to its task successfully, the venture into severe-service territory was not without consequence: the accidental discovery of an uncontrollable temperature change in the first stage of Unit 3’s steam turbine.
Sim Gideon plant operations and engineering personnel reviewed the long-term risks and benefits of load following at this ramp rate. After reviewing the data, plant personnel became very concerned about what was not being controlled. The primary concern was that the rate of change of turbine first-stage shell temperature was excessive on sustained load ramps. The data files were printed and compared with starting and loading charts supplied by GE.
The comparison raised questions about potential damage to the turbine rotor. In the past, Sim Gideon Unit 3 had a more restricted load-following range. With the upgrade of its control systems, which enabled much faster ramp rates, the allowable level and rate of temperature change rose considerably. What’s more, a loading cycle now could be completed three times faster—in 20 minutes instead of 1 hour.
As soon as the Sim Gideon staff began comparing data, they knew they had a problem. GE’s charts for rate of rotor temperature change topped out at 600 degrees F/hr, and Unit 3 was averaging over 900 degrees/hr, with peaks as high as 1,600 degrees/hr. GE was asked to supply new curves and to confirm the extent of damage that the turbine could suffer from being operated in this way.
According to the GE "1,000 cyclic life expenditure (CLE) curve" on hand, cycling the turbine three times that day in April 2004 had used up 0.3% of its life. In other words, the unit could be operated in that way only another 997 times without risking a catastrophic crack of its high-pressure (HP) rotor. This was unacceptable to plant managers, who asked both GE and Foxboro for guidance toward a solution.
To no one’s surprise, GE suggested reducing the ramp rate so the turbine would operate within the limits of its cyclic life curves. Foxboro’s advanced control group replied that none of the 50 large turbine control systems it had installed since serial No. 1 at Sim Gideon had reported any problems of this nature. But because many of these systems were operating at similarly high ramp rates, Foxboro agreed to look into the situation immediately.
Following an internal consultation, Foxboro’s advanced controls group decided to optimize the rate of change using the GE CLE curves. This would require both predicting future temperature changes and analyzing the cumulative changes that the turbine had already endured. Foxboro sent personnel to the site to begin studying the system with an eye toward developing a strategy for mitigating the life-expenditure effects of unit load following and cycling.
Testing a new design
After reducing Unit 3’s ramp rate during dispatch, Sim Gideon began investigating other ways to reduce cyclic life expenditure. One was to apply both a modified sliding-pressure (MSP) approach and a multivariable steam temperature control approach to achieve higher ramp rates.
In MSP, throttle pressure is varied toward a target value under the supervision of a superheat steam temperature control system with sufficient range. If the range is exceeded (for example, if spray valves are nearly wide open or closed), throttle pressure is pulled back until steam temperature conditions are favorable. In multivariable control, the throttle pressure setpoint is adjusted based on HP rotor temperature, superheat steam temperature, and superheat spray demand variables. For typical dispatch operation, there should be adequate opportunities to make throttle pressure adjustments while meeting load and ramp rate objectives.
Testing during the investigation demonstrated that using MSP at low loads reduces HP rotor temperature change during ramping and allows faster ramp rates consistent with CLE guidelines. However, MSP operation also requires coordinated use of multivariable steam temperature control to maintain superheat steam temperatures near the setpoint. The number of burners in service and their tilts, superheat sprays, and IFGR damper position must be precisely controlled. Due to the slow temperature response at low load and the multivariable requirements, Sim Gideon staffers chose a POMS as the control methodology.
To further increase ramp rate potential, engineers recommended reducing the maximum load for fast ramping from 330 MW to 315 MW. This would provide a zone from 60 MW to 315 MW at the fastest possible ramp rate. Load increases from 315 MW to 330 MW would be at a very low ramp rate. This restriction is due to the high first-stage metal temperature gradient at high loads.
The table presents calculated average ramp rates consistent with the 10,000-cycle HP rotor CLE curve. Note that in MSP mode at low load, there is an increase in superheat steam temperature from 995F to 1,000F.
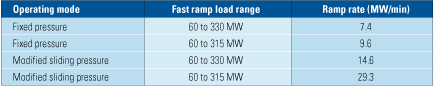
The electric slide. Performance improvement achieved by sliding-pressure operation. Source: LCRA
Tight curves ahead
Achieving the desired ramp rate requires close control of superheat steam temperature. By coordinating control of the throttle pressure setpoint, the number of burners in service and their tilts, superheat sprays, and the position of the IFGR damper, the POMS system can provide adequate superheat steam temperature control while maintaining first-stage metal temperatures within desired constraints.
Sim Gideon engineers then developed a test plan for investigating the ability of control methodologies to increase unit ramp rate while maintaining the rate of HP turbine metal temperature change within acceptable limits. The unit ramp rate is currently limited by HP turbine rotor CLE considerations, as determined by the turbine vendor’s starting and loading instructions (SALI) curves (Figure 2).

2. Limiting factor. Unit ramp rate is limited by the high-pressure turbine rotor’s cyclic life expenditure. Source: LCRA
The asymptotic shape of the SALI curves suggests that a small decrease in total HP rotor temperature change provides a large potential increase in the allowable rate of change of temperature for the same CLE. If the total HP rotor temperature change could be reduced from the current maximum of 170F to a range of 115F to 135F, the ramp rate could be maintained at a higher value without exceeding the desired CLE.
The testing also investigated the use of MSP to increase HP rotor temperature at low loads. By operating at lower throttle pressure at low loads, throttling losses are reduced and higher steam temperatures are attained at the turbine’s first stage. With increasing load, the throttle pressure is ramped back to normal, producing a net lower temperature change of the first-stage metal over the load range.
Temperature changes in the HP rotor cause the stress expressed as CLE by the turbine vendor. Each temperature cycle consumes a percentage of cyclic life. LCRA would like to operate on the unit’s 10,000-cycle curve, which corresponds to the 0.01% CLE/cycle curve in Figure 2. The red vertical line at 170F corresponds to the maximum HP rotor temperature change from minimum load to full load. To remain within the 10,000-cycle curve, the rate of temperature change should not exceed 280 degrees F/hr. The dispatch rate and load end points dictate both the change in HP rotor temperature and the rate of change of temperature. Figure 3 presents first-stage and superheat temperature data during typical load dispatch operation.

3. One day at a time. Load, turbine first-stage temperature, and superheat temperature during dispatch of Sim Gideon Unit 3 on a typical day. Source: LCRA
Testing confirmed that there is considerable variability in the relationship between first-stage metal temperature and load due to the slow response of turbine metal temperature, particularly at low load. Figure 4, developed by LCRA engineers, represents the steady-state relationship between load and first-stage metal temperature.
The steep slope of the overall curve in Figure 4 suggests that restricting fast ramping at very high loads may have the beneficial result of reducing HP rotor stress. At lower loads, where the curve isn’t as steeply sloped, the benefit may not be as great. However, data collected during the tests do indicate the potential benefit of reducing temperature variation even at low loads by raising the first-stage metal temperature by operating the unit in sliding-pressure mode.

4. Hot topic. LCRA engineers determined the steady-state relationship between load and turbine first-stage metal temperature, a key for controlling ramp rates. Source: LCRA
Testing the new design
The next round of tests investigated the concurrent use of MSP and control of steam temperature sprays and the number of burners in service and their tilts to reduce temperature changes in the HP rotor. The testing was conducted in two phases. First, engineers quantified the potential increase in HP rotor temperature from running in sliding-pressure mode and the feasibility of operating at lower throttle pressure at low loads. During the second phase, engineers verified that the unit can maintain a high ramp rate at low loads while in sliding-pressure mode. The testing, which combined burner transitions, burner tilts, and spray control to effectively regulate steam temperature and turbine metal temperatures, used ramp rates of 18 MW/minute from minimum load to approximately 40% load.
The focus of this testing was on the low-load range, where sliding pressure can be effective at raising turbine metal temperatures and thereby reducing temperature changes during ramping. The tests were conducted during the early morning hours of October 28 and 29, 2004. Data acquired on October 28 included low-load numbers, the values for fast ramping to high load, and high-load steady-steady figures. This data provided additional information on turbine metal temperatures and steam temperature control requirements.
A Wonderware system (www.wonderware.com) was used to collect the data at 10-second intervals. The operator ably performed manual control on several loops affecting steam temperature to provide more effective control and data suitable for modeling. Foxboro’s Connoisseur system was used to analyze the data.
First-day tests
The first tests, conducted at 60 MW, determined the relationship between HP rotor temperature and sliding-pressure and superheat steam temperature. The pressure was lowered via a series of ramps that applied several rates and amplitudes to achieve an end point pressure of approximately 1,525 psig
.
Lower and upper burner pairs were removed from service and returned to service sequentially, to observe the effect on superheat steam temperatures, superheat spray flows, and gas header pressure. Then the burner tilts were moved to quantify the impact on steam temperatures.
The burners, tilts, and sprays were then controlled during a fast-pressure ramp test to regulate steam temperature. Pressure was ramped from 1,525 psig to full pressure and then returned to a low value of 1,595 psig prior to returning the unit to dispatch control.
Figure 5 illustrates the results of the throttle-pressure ramp tests in sliding-pressure mode. The trend lines represent load, throttle pressure, first-stage metal temperature, superheat temperature, burner tilt position, spray valve positions, and the number of burners in service. The values in white correspond to the white vertical timeline near the left axis and are the conditions at the start of the test: a 760F first-stage metal temperature at full pressure and low load. The values in color represent the low and high range values for the individual variables, corresponding to the tick marks on the left side of the trend.
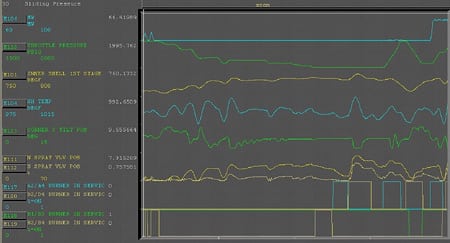
5. Lowering the pressure. Throttle pressure ramp tests are illustrated here. The values in white correspond to the white vertical timeline near the left axis and are the conditions at the start of the test. Source: LCRA
The trend lines of Figure 6 present the key results of the first series of tests. Lowering the throttle pressure increases the temperature in the first-stage shell, subject to variations in superheat temperature. The white timeline indicates a first-stage temperature of 783F at 1,525 psig and a throttle temperature of 992F. The automatic spray control was challenged to regulate steam temperature during pressure ramping.

6. First-day test results. Lowering the throttle pressure increases the first-stage metal temperature, subject to variations in superheat temperature. Source: LCRA
During the fast pressure ramp test (from low pressure to full pressure and back again), manipulating the number of burners in service, and their tilts and sprays, helped reduce steam temperature variations. The steam temperature effects demonstrated during the tests were applied during the second night’s load ramp testing to reduce steam temperature variations.
No major control issues arose during this test. Drum level and deaerator level were effectively controlled. There was an occasional alarm for a feedwater heater level, but that did not appear to be cause for concern.
Second-day tests
The primary objective of the second series of tests was to evaluate the impact of MSP on the unit’s ability to ramp to load. A secondary objective was to collect data to support the possible design of a solution using model predictive control by a POMS. Because test time was at a premium, pursuing both goals simultaneously seemed warranted. For this reason, operators manually controlled the primary steam temperature control loops of burner tilts, the final superheat temperature, and the number of burners in service.
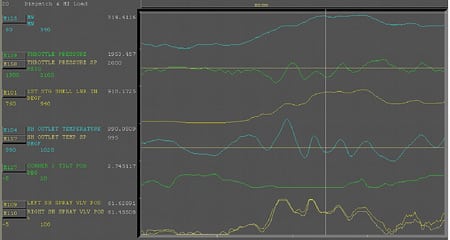
Figure 7 illustrates the results of the load ramp tests conducted during the second night. Start conditions are shown in white and correspond to the white timeline on the far left. Pressure was ramped from 2,000 psig to 1,500 psig at 30 psi/min while varying the number of burners in service. Steam temperatures were effectively maintained within a narrow range. There was a subsequent drop in steam temperatures due to an operator’s initial misunderstanding of the inverse relationship of final superheat controller output and the position of spray valves. Later, using manual control, he was able to maintain steam temperature relatively close to the setpoint for the remainder of the load ramp tests.
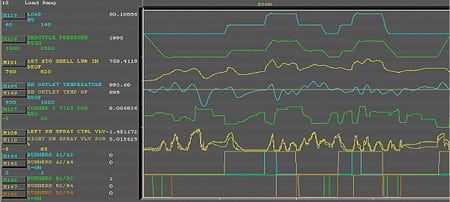
7. Second-day test results. The increase in first-stage temperature of approximately 34 degrees F from the full-pressure start condition represents a reduction in temperature variation from 170F to 136F from low load to full load. This yielded a 60% increase in the allowable rate of change of temperature for the 10,000-cycle cyclical life expenditure curve. Source: LCRA
The load was first ramped from 60 MW to 90 MW while pressure was increased from 1,500 psig to 1,650 psig. Then load was ramped to 130 MW at 1,850 psig. The concern was that the combined effect of building load and pressure would cause high steam temperatures. Peak steam temperatures were readily controlled, but a dip did occur following the ramp, indicating a need for further control action. The subsequent load reductions and load increases all resulted in smaller steam temperature variation, due to improved operator control action.
Test results showed an increase in first-stage temperature of about 34 degrees F from the full-pressure start condition. This represents a reduction in temperature variation from 170 degrees to 136 degrees from low load to full load. According to the HP rotor temperature SALI curve, the reduced temperature range provides a 60% increase in the allowable rate of change of temperature for the 10,000-cycle curve (from 280 to 440 F/hr) and an allowable increase in average ramp rate from 7.4 to 14.6 MW/min between 60 MW and 330 MW.
There is a very steep gradient of first-stage temperature at high load. If the maximum load for fast ramping is limited to 315 MW, the range of first-stage temperature change is reduced by 20 degrees F. Applying MSP and this load limit for fast ramping reduces the HP rotor temperature range to 116F for an allowable rate of temperature change of more than 800 degrees F/hr for the 10,000-cycle curve, or an average ramp rate of 29.3 MW/min. In fixed-pressure operation, the 150F variation for a 315-MW maximum load permits a temperature change of 340F/hr, corresponding to a ramp rate of 9.6 MW/min.
During the final load ramp test, load was added at 18 MW/min from 60 MW to 130 MW and then back again. The throttle-pressure setpoint was ramped at 45 psi/min up from 1,500 psig to 1,650 psig, and then to 1,850 psig during the increasing load periods. Pressure was ramped from 1,850 psig to 1,500 psig at 30 psi/minute during the load down-ramping. The pressure ramp rates, which were specified by LCRA engineering, are consistent with the start-up steam drum limitations of 200 degrees/hr for increasing temperature and 150 degrees/hr for decreasing temperature. The total range of superheat temperature variation was 977F to 1,008F while load varied from 59 MW to 131 MW and pressure varied from 1,488 psig to 1,858 psig.
There was no explicit testing conducted at high load. However, the unit was ramped from low load to full load during the afternoon of October 28. As the unit was ramped at 18 MW/min, the steam temperature increased to 1,025F with the spray valves full open. The load ramp was stopped until the steam temperature dropped to an acceptable value, and then continued. Figure 8 shows the next set of trend lines, 20 minutes later. A load of 315 MW was reached at 12:51:32, or 20 minutes after the start of the ramp, as indicated by the white timeline.
8. Fast load ramp. A load of 315 MW was reached in 20 minutes as part of a load ramp test, as indicated by the white timeline. Source: LCRA
The first-stage metal temperature reached 918.2F at 12:51:32, representing a 150-degree temperature rise in 20 minutes, or 450F/hr. Based on the SALI curve, this corresponds to a CLE of 0.02%, or a 5,000-cycle curve. Although the unit was ramped at 18 MW/min at times, the average ramp rate was 11.25 MW/min. The slow temperature response of the first stage produced a lower-than-normal temperature for the 90-MW condition at the start of the fast load ramp. This contributed to the large first-stage metal temperature change.
These data indicate that the 18 MW/min ramp rate may exceed the allowable CLE 10,000-cycle curve if load is ramped from low load to nearly full load. If steam temperatures had not limited the load ramp, it is likely that a faster rate of temperature change would have produced even greater cyclic life expenditure.
With MSP in place, the temperature variation would have been approximately 120 degrees instead of 150 degrees, due to a higher first-stage metal temperature at low load. The 10,000-cycle curve allows an 800F/hr rate change for operation, which corresponds to an allowable 25 MW/min ramp rate.
Achieving these fast ramp rates with MSP depends on the ability to control steam temperatures. In this test, steam temperatures reached 1,025F with tilts low and superheat sprays at maximum. Because gas header pressure was high, it is unlikely that burners could have been turned off. Another control variable would have to have been used to lower transient temperature.
Writing final specs
Space limitations preclude presenting the details of other tests, of which there were many. However, here are the final system specifications that were implemented in the Sim Gideon control system that maximizes Unit 3’s ramp rates:
- Implement MSP controls with a low setting of about 1,500 psig.
- Increase the low-load superheat temperature setpoint from 995F to 1,000F.
- Lower the maximum load in the fast ramp range from 330 MW to 315 MW and configure the 315 MW to 330 MW load range for slow ramping.
- Use the POMS to coordinate multivariable control of the throttle-pressure setpoint, the number of burners in service and their tilts, superheat sprays, and IFGR damper position.
- Upgrade the POMS computer for faster control and compatibility with Connoisseur software.
- Use an on-line algorithm to calculate and accumulate CLE.
Currently, Sim Gideon staff are implementing the "Turbine One-Button Start" project to further automate plant and unit control. The project envisions taking the steam turbine from a cold start to closure of the breaker at 3,600 rpm. Modules to be installed as part of the retrofit will also start the vacuum pumps and reset the turbine. After the breaker is closed, the modules will control load holds and load ramp rate, and assume control of the turbine’s control valves from the stop valves. The system can operate in advisory mode as well as in control mode.
Significantly, the design of the control system will also require capture of "institutional knowledge" that must be quantified in order to automate the plant. When the project is completed, the consistency of start-up and unit operations should improve, start-up times should be reduced, and LCRA’s new dispatch center should be able to operate the units directly.
The author would like to acknowledge the LCRA Sim Gideon operations, engineering, and management teams for making the testing and implementation of the MSP approach at Sim Gideon Unit 3 so successful. Special thanks go to John Lax for his in-depth analysis of the HP rotor temperature limitations and sliding-pressure boiler constraints, to Keith Trolinger for test coordination and guidance on ramp rate issues, to Robert Chapa for control coordination and Wonderware data collection, to Steve Slater for instrumentation and control guidance, and to Matthew Henderson for the expert boiler control during these tests. A final shout-out goes to Don Labbe of Invensys/Foxboro, who also did yeoman’s work.
—David Runkle is production manager of LCRA’s Lost Pines Power Park. He can be reached at drunkle@lcra.org.