Industrial Internet of Things (IIoT) technologies can help make electric generating plants more efficient while increasing availability.
The electric power industry is going through a transformational change: increasing renewables from wind and solar, the development of battery storage technology, and the increased pressure to lower operational expenditures all lead to the need for increasing operational flexibility. Having a plan to bring a utility into the future through the right set of sensors, cybersecurity policies, and data analytics will help keep plant assets in a healthier state as facilities cycle more frequently.
Process industries—including electrical utilities—have been enhancing their operations with digital transformation, brought about through the adoption of the Industrial Internet of Things (IIoT). While the first step in digital transformation fulfills the data-creating side of the picture, it must be balanced with corresponding analytics to be effective.
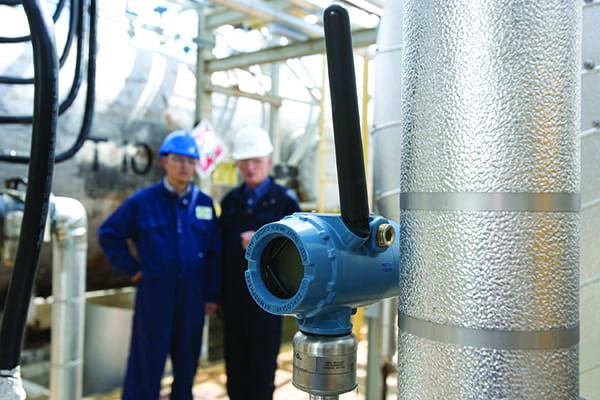
Analytics platforms designed to crunch and sort data gathered via smart sensors are providing users with the ability to apply predictive diagnostics to equipment and assets. More data is available now than ever before, largely due to new sensors supported by WirelessHART transmitters. It is now possible to collect continuous condition and performance data on large populations of assets (Figure 1) thanks to lower hardware and installation costs.
 |
|
1. New WirelessHART sensors can monitor a variety of conditions on growing numbers of manufacturing assets. Courtesy: Emerson |
New wireless pressure, temperature, vibration, acoustic, corrosion, and flow monitoring sensors—as well as others—make it practical to monitor assets such as:
- ■ Pumps, motors, and gearboxes.
- ■ Heat recovery steam generators (HRSGs).
- ■ Cooling towers.
- ■ Heat exchangers.
- ■ Leaking steam traps.
- ■ Leaking pressure relief valves.
- ■ Leaking drain valves.
- ■ Piping for flow-accelerated corrosion.
The ability to install wireless monitoring sensors without the need for costly wiring infrastructure or a requirement to integrate them into an automation host system, makes it practical to collect data on large numbers of assets. With lower installation costs, a quicker return on investment (ROI) can be realized.
Applying Analytics
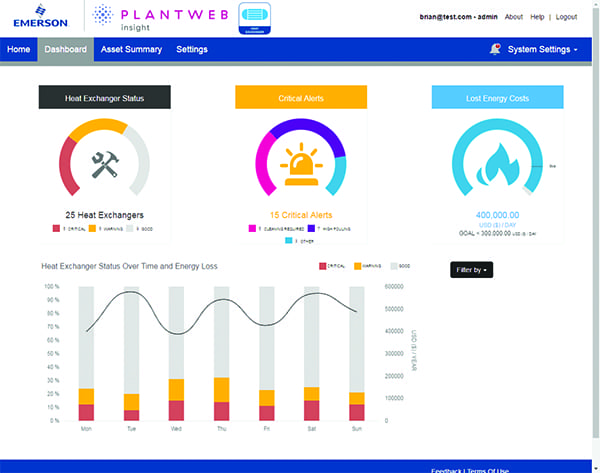
Data generated by all these new sensors has to be collected and analyzed to extract meaningful and valuable information. First-principle models and analytics can be developed for an increasing number of abnormal situations, root causes, and failure modes related to specific types of assets. For example, the kind of data taken from a heat exchanger (Figure 2) must be examined using a different model than data from a centrifugal pump.
 |
|
2. Today’s analytics platforms have pre-configured dashboards, which can display the results of specialized calculations. Courtesy: Emerson |
Once processed, engineers can use data to predict problems before they affect operations. This allows maintenance, reliability, safety, plant engineering, and other departments to make quicker, more-intelligent decisions about their operations. With these educated decisions come cost savings, cost avoidances, improved maintenance and reliability, better safety, and improved heat rate.
Supporting Analytics
The data analytics platforms available today can be deployed in a variety of ways to suit a company’s needs. Often users choose to install them on physical servers, standalone workstations, edge appliances, or virtual servers. For those not wanting the internal hosting responsibility, these applications can be cloud hosted. The host type and location are up to the user and should reflect the larger corporate digital transformation strategy.
Some companies prefer to run asset-based analytics on the edge or on-premise to perform diagnostics and other computations closer to the asset itself. This allows decisions affecting reliability, maintenance, and heat rate to be made quickly and intelligently at the source. On the other hand, cloud environments are often more practical to support deeper analysis into fleet-wide aggregated data on costs and efficiency. In any situation, the use case should dictate where the analytics interact and live.
End-users needing to perform such analyses in-house often found they had to create much from scratch, using expensive custom programming and unique user interfaces. Time lags were inadvertently built in, as even simple files were run on general-purpose software applications, such as Microsoft Excel. These types of efforts resulted in specialized feedback but weren’t built for scalability or continuous data processing.
With newer platforms, these insights can now be realized anywhere and anytime on a more-continuous basis. Edge applications continuously assess the health of equipment, assets, and processes, rather than waiting for periodic manual analysis. This allows quicker feedback for better decision-making. New platforms are built around specialized applications that focus on specific types of plant assets or subsystems. This allows them to perform specialized analytics without requiring custom code writing, display graphics development, or vast expertise and experience from the user.
Such applications can work in combination with active or passive subsystems, because they can connect with the instrumentation directly or, if desired, work through the distributed control system (DCS) or other host system. Most users find this type of integration unnecessary, but it is possible when working in a legacy environment.
Applications for Power Generation
The question at hand becomes how an electric utility can apply these concepts to individual units within its fleet. There is no single answer, because most utilities have a variety of plant types and ages. Fortunately, the adaptability of these applications makes them suitable for the newest combined cycle gas turbine units or the oldest sub-critical coal boilers. Given the constraints of an article such as this, the discussion scope will be narrowed to the former.
Many combined cycle plants originally conceived to run infrequently, now find themselves running baseloaded or as cycling units. These plants were often built with minimal automation to reduce costs, which leaves them under-instrumented for how they need to operate today. Fortunately, these upgrades are not major undertakings and many can even be done while in operation.
Often the first question that emerges is: “Where do we start?” Determining the answer begins by evaluating current conditions. Questions that need answering include:
- ■ What assets are maintenance “bad actors,” demanding an inordinate amount of attention?
- ■ What assets caused recent unscheduled outages?
- ■ Which individual assets have suffered unexpected breakdowns?
- ■ What condition and performance evaluations are still being performed manually?
The answers point to areas where monitoring can have the greatest effect.
Suggested Projects
Working with many combined cycle plants, Emerson engineers have observed how operators and maintenance teams answered the questions above. Here are three examples of how individual plants have used wireless monitoring and analytics to solve problems and improve operations.
Cooling Tower Automation. The most ambitious project is often adding a series of monitoring sensors to cooling towers to increase reliability and enhance their effectiveness. Ideally, any installation should be equipped with a full complement of instrumentation, including:
- ■ Supply, makeup, blowdown, and recirculation water flow.
- ■ Air, and cooling water supply and return water temperatures.
- ■ Cooling water basin level.
- ■ Water conductivity and pH.
With data from these instruments, it is possible to determine the efficiency of cooling tower heat exchange equipment and tell if there is internal buildup or fouling of liquid or air passages. There are other sensors, including vibration and bearing temperature, which can be added to the motors and gearboxes driving fans or pumps. These can warn of developing mechanical problems, allowing corrective action to be taken in advance of failure.
Monitoring cooling towers is a significant undertaking, but it can be approached incrementally. The sensors necessary to monitor cooling efficiency are not associated with those monitoring the mechanical elements, so each can be installed and implemented one at a time.
Tube Leaks. HRSGs capture heat from gas turbine exhausts and can suffer leaks in superheater and reheater tubes, often related to welds and adjacent heat-affected zones. Such leaks can be anything from a pinhole to a complete break. The small leaks are particularly difficult to detect and locate without a complete shutdown and tube-by-tube inspection.
Such leaks can often be captured and identified by acoustic monitors, which can then send their data to maintenance personnel via a WirelessHART network. When applied strategically, acoustic monitors can warn operators that a leak has developed, often well before an increase in makeup water is detectable.
The monitors can be attached from the outside of piping without any process penetrations or shutdown. They can identify which section of tubing is affected, the approximate size of the leak, and if the problem is getting worse. This information helps maintenance crews determine when the situation has advanced enough to call for a shutdown, or if it can be left alone.
CEMS Calibration Gas. Continuous emissions monitoring systems (CEMS) need bottles of gases to calibrate the analyzers. Often these racks of bottles are equipped with mechanical gauges to measure gas pressure and inventory. Operators have to check these gauges during manual rounds and if they are neglected, gas can run out, shutting down the analyzers. Shutdowns or fines from regulatory agencies invariably follow.
Those mechanical gauges can be replaced by more advanced gauges, which can send their data for evaluation via WirelessHART, in addition to a traditional method. A simple, yet powerful, analytical application can display all readings remotely and warn maintenance when pressure is low. Manual rounds can continue, if desired, but performance does not depend on them.
This is one of the smallest-scale examples and can be deployed in an afternoon, but it still proves the concept. It reduces dependence on manual rounds and improves inventory management while avoiding the potential for fines or a shutdown due to gas running out. Similar projects can be implemented across a facility to reduce manual rounds and replace them with continuous, reliable data and insights.
These projects, whether large or modest, all aim to enhance operational availability, reduce costs, and improve overall effectiveness—and together they drive greater profitability. These new tools deliver scalability and are easier than ever to implement. ■
—Brian Joe is a wireless product manager, and Juan Panama is a global business development manager for the power industry for Emerson’s Automation Solutions business in Shakopee, Minnesota.