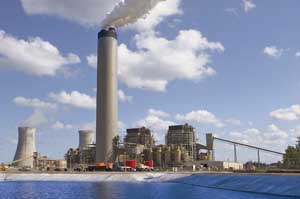
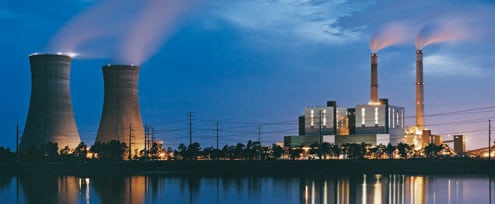
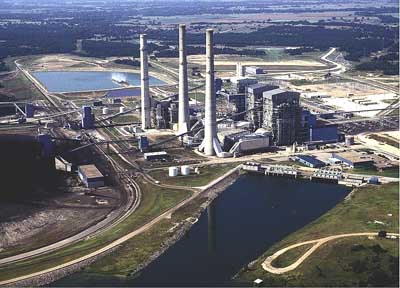
Seminole Electric Cooperative’s (SEC) Seminole Generating Station (SGS) features two 650-MW coal-fired units located on the St. Johns River, about 50 miles south of Jacksonville, Florida (Figure 1). The plant’s primary fuel is eastern bituminous coal from mines in western Kentucky and southern Illinois but it is also capable of firing a combination of coal and petroleum coke (pet coke) when fuel purchase economics dictate the latter. In the fall of 2006, Foster Wheeler replaced the existing, older-generation controlled-flow split-flame burners on Unit 1 with Foster Wheeler’s new Vortex Series (VS) low-NOx burners and overfire air (OFA) additions to further reduce NOx emissions. This case study reports on those modifications and presents the post-installation test results.

1. Seminole Electric Cooperative’s 1,300-MW, two-unit power plant can burn eastern coal or a combination of coal and pet coke. To put the scale of the plant into perspective, the plant’s hyperbolic cooling towers are 450 ft tall and 400 ft across at their base. The plant stack is 675 ft tall. Courtesy: Seminole Electric Cooperative
Fire in the Hole
Each SGS unit features opposed wall-fired Foster Wheeler (FW) boilers that entered commercial service in 1983 and 1984. Each unit was designed for 4,700,000 lb/hr MCR at 1,005F/1,005F main and reheat steam conditions. The design of each steam generator included moderately high burner zone heat release rates that are known to have a higher potential for NOx formation.
Each boiler is equipped with six double-ended ball mills that deliver pulverized coal to 36 controlled-flow, split-flame burners, configured as three elevations of six burners on both the front and rear walls. In 1986, FW retrofitted an OFA system on the front and rear walls of both boilers. Normal full load of 700 MW gross is achieved with all six mills in service and the top feedwater heater out of service.
Analyses of Dotiki and Patiki coals, the most commonly used at SGS, and fuel blends of 30% pet coke and 70% coal by weight are shown in Table 1. The volatile content of the pet coke is only 10%, which is typical for delayed pet coke.
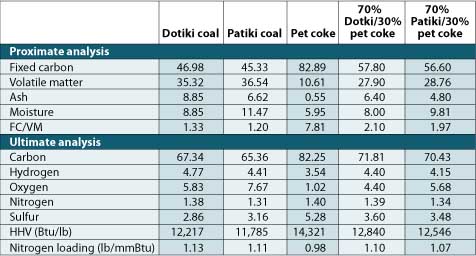
Table 1. Coal and pet coke analyses for Seminole Generating Station. Source: Foster Wheeler
The decision to fire coal alone or in a mix with pet coke is an economic one, based on the swings in fuel prices. Dotiki and Patiki coals are similar in composition and nitrogen loading (a key coal property related to NOx emissions) and also are relatively high in sulfur content. Usually, high sulfur content is a good indicator of high slagging potential due to the presence of iron in the form of pyrite (FeS2). Pyrite is known to promote boiler waterwall slagging due to the formation of relatively low melting phases in a reducing atmosphere or as a result of poor combustion. Ash analysis of both coals shows that the iron content ranges from 15% to more than 20% Fe2O3.
In the fall of 2006, FW replaced the existing controlled-flow split-flame burners on Seminole Electric Unit 1 with new VS low-NOx burners to further reduce NOx emissions. In addition, the OFA system was upgraded with new FW VS OFA registers to provide increased OFA flow and better mixing. These same modifications were made to Unit 2 during the spring of 2007.
Newer, Cleaner Burners
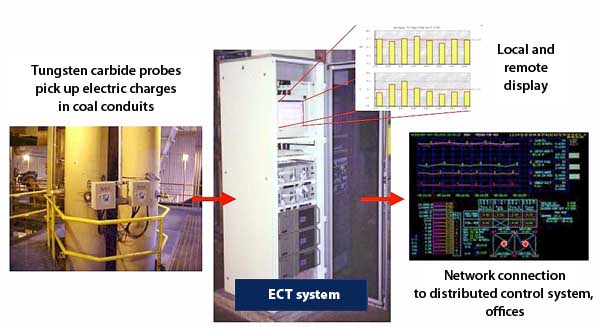
The new VS burners utilize an elbow coal inlet, whereas the existing, older-generation low-NOx burners used a scroll inlet (Figure 2). These new burners also feature secondary airflow measurement capability. For Unit 1, a temporary register air distribution measurement (RADM) system was installed for measuring burner airflow. A temporary electric charge transfer (ECT) system was also installed to measure coal flow and velocity in each of the 36 coal pipes. The new adjustable riffles on the ball mill outlets were used to balance coal flow in the pipes, as measured by the ECT system.

2. Compare the original Foster Wheeler burner with the new Vortex Series low-NOx burner. Source: Foster Wheeler
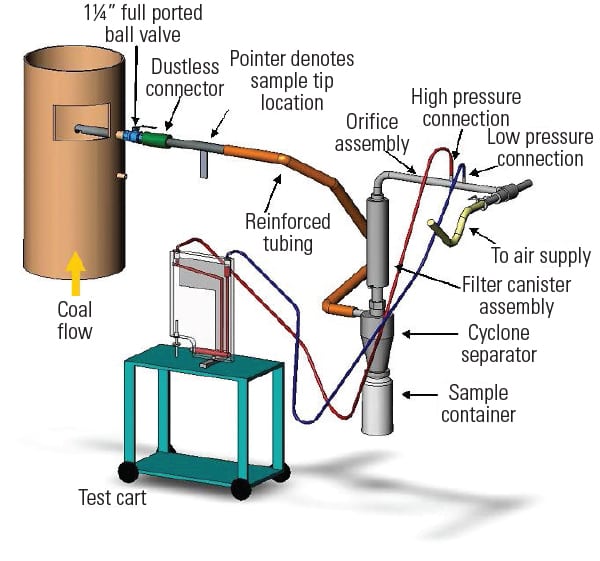
Figure 3 illustrates the major components of the ECT system. Three probes in each conduit are needed for coal flow measurement and six for coal flow and velocity measurement. The probes are connected to a signal conditioning unit housed in a cabinet, which is in turn connected to a personal computer that is used for data processing and analysis. The wear-resistant, tungsten carbide probes are easily installed through the wall of the existing conduit and inserted into the coal stream. The electric charge present in two-phase flow transport is then measured to determine the relative coal distribution between conduits. In addition, the system can be configured to measure the flow velocity and the absolute flow in each conduit.
3. Major components of the Electric Charge Transfer (ECT) system. Courtesy: Foster Wheeler
The existing OFA system was also upgraded to provide increased airflow and penetration into the firebox (Figure 4). The existing OFA throats located above the inner four burner columns were reused with new VS OFA registers. New OFA throats and registers were installed at the same elevation above the outboard burner columns on both the front and rear walls.
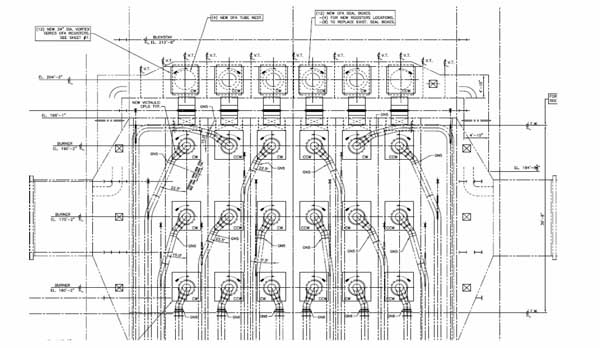
4. General arrangement of VS burners and OFA system at Seminole Generating Station. Source: Foster Wheeler
Computational fluid dynamics modeling was conducted to design and confirm adequate airflow to all the overfire registers. Baffle and turning vanes were also added inside the windboxes to better distribute incoming secondary airflow to the burners and OFA system. The upgrade of the OFA system resulted in an increase in OFA flow from approximately 10% to 25% of the total combustion air used to further reduce NOx formation in the upper portion of the combustion zone.
Balancing Coal and Air Flows
Sufficient coal flow and airflow balancing is required to optimize the performance of today’s advanced low-NOx combustion systems. This balance is important to minimize CO emissions and flyash loss of ignition (LOI) when achieving low NOx emissions.
Unit 1 coal balancing was performed by adjusting the FW riffles installed at both outlets of each ball mill that are checked by the ECT coal flow measurement system (Figure 5). Each assembly has the capability of diverting coal flow between the three outlet coal pipes at each end of the ball mill as well as some side-to-side distribution control.

5. An adjustable riffle assembly was installed on the 12 total mills used in Seminole’s two units. Courtesy: Foster Wheeler
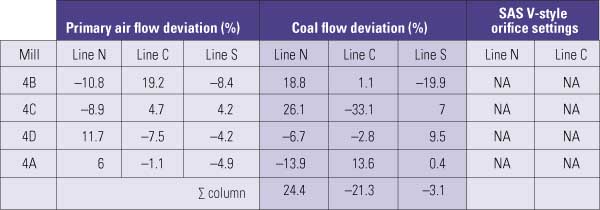
Table 2 compares the coal pipe flow distribution for the burners for each mill before and after riffle adjustments and the improved coal flow balance. Significant improvement in coal pipe flow distribution was achieved by riffle assembly adjustment for most of the mills. Riffle adjustment for improvement of coal flow distribution for mills 3 and 5 was not necessary, because emission performance requirements were already met.

Table 2. Average percentage deviation from balanced coal flow. Source: Foster Wheeler
For Unit 1, RADM airflow distribution readings were taken in order to determine the as-found, nonadjusted secondary air distributions following retrofit of the new burners and installation of flow-correction devices in the windboxes. All FW VS registers are equipped with a non-pitot-tube-based measurement of secondary airflow. The system measures the pressure drop generated by the burner to calculate secondary airflow. A range of register sizes was calibrated in our full-scale burner test facility and flow equations were developed for the entire size range at various settings. The RADM system is designed to automatically measure the pressures at specific locations in the windbox and in the burner registers.
The RADM system consists of a windbox cabinet that houses the pressure measurement equipment and a central cabinet that contains the power line carrier communication system to the field devices, sampling valves, an air purge system to clean the impulse lines, and the central PC. Figure 6 is an example of a graphical interface that is provided with the RADM software to show various operating views and trends generated from RADM measured/calculated data.

6. RADM burner column airflows are displayed for Unit 1. Courtesy: Foster Wheeler
Table 3 shows the average secondary air imbalance for the burners for each mill. It should be noted that the burner sleeve dampers were adjusted for minimum NOx and CO, not to achieve the best secondary airflow balances. As shown in this table, excellent secondary air distribution was achieved for all of the mills except mill 3 and was within the target level of ±15% from average.

Table 3. Average burner secondary air deviation from balanced flow for each of Unit 1’s mills. Source: Foster Wheeler
The sum of the individual burner secondary airflows to both the front and rear walls was used to determine the balance from front to rear. The secondary airflow distribution was approximately 53%/47% for the front and rear walls and was well within ±10% from average. This distribution is excellent considering that mill 2 was out of service on the rear wall during these tests.
Reaching New Lows
Baseline testing was performed on Unit 1 during January 2006 with a blend of 70% Patiki coal and 30% pet coke prior to the combustion upgrades. The low-NOx combustion system retrofit for Seminole Unit 1 met and surpassed all of the emissions and coal flow and airflow balance guarantees. The results of this very successful retrofit are summarized next.
Pre-retrofit NOx emissions were 0.53 lb/mmBtu at a load of 700 MW with all mills in service and the top feedwater heater out of service. Post-retrofit NOx emissions collected during a performance test conducted in March 2007 were below 0.35 lb/mmBtu for a blend of 70% Patiki coal and 30% pet coke (Figure 7). This corresponds to a reduction in NOx of approximately 35%. Also shown in Figure 7 are NOx emissions for 100% Dotiki coal and a blend of 70% Dotiki coal and 30% pet coke. Unit 2 was retrofitted with the new low-NOx system in April 2007 and began start-up in May 2007 with comparable NOx reduction numbers.

7. NOx versus load for coal and pet coke blends for Unit 1. Source: Foster Wheeler
CO emissions of less than 175 ppm were attained over the load range during performance testing (Figure 8). The CO emission target of 200 ppm was easily met with a blend of 70% Patiki coal and 30% pet coke and was well below the baseline prior to the retrofit (125 ppm versus 167 ppm). The low CO emissions can be attributed to fine control of the secondary air and good jet penetration and mixing of the OFA with the combustion gases rising from the burner zone.
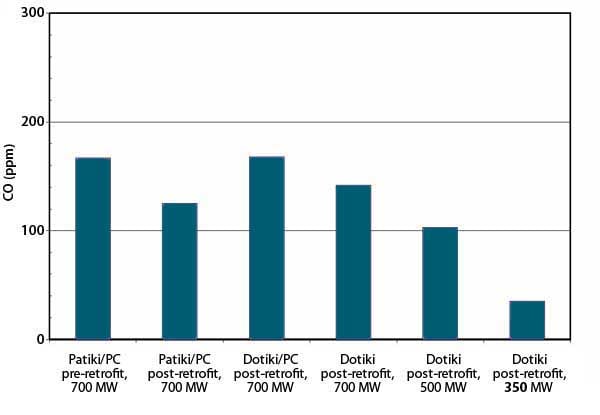
8. CO versus load for coal and pet coke blends for Unit 1. Source: Foster Wheeler
Increase in flyash LOI is a common concern with retrofit of all low-NOx combustion systems. This is particularly true for fuel blends containing low-volatile pet coke. The low volatile content of the pet coke makes it difficult to ignite, while its very low porosity makes if difficult to attain burnout of larger particles. To complicate matters, the pre-retrofit coal fineness at Seminole was relatively poor, with approximately 3% retained on 50 mesh. Although some ball mill maintenance was performed during the retrofit, flyash LOI was similar to or lower than for Seminole Unit 1 after retrofit of the low-NOx combustion system, when firing 100% bituminous coal and blends with pet coke.

9. Unit 1 pre- and post-retrofit flyash loss on ignition. Source: Foster Wheeler
LOI was slightly lower for the pet coke blends but was significantly lower for 100% Dotiki coal (Figure 9). This reduction in LOI is quite remarkable considering the substantial reduction in NOx that was achieved and the poor coal fineness.
—Richard E. Conn and John Grusha (john_grusha@fwc.com) are with Foster Wheeler North America Corp. Gary Norman with Seminole Electric Cooperative Inc.