Combustion uniformity is the key to the lowest emissions as well as the best boiler efficiency. To achieve that uniformity, many power generators struggle to balance pipe-to-pipe fuel flow distributions as part of a low-NOx burner replacement or as part of combustion optimization. They do so because it has often been claimed that balanced pipe-to-pipe fuel flow distribution is the only path to uniform burner-to-burner stoichiometries and uniform combustion. However, this belief assumes that there is adequate secondary airflow to maintain uniform burner-to-burner stoichiometries. In essence, it is uniformity of the burner-to-burner stoichiometries—not balanced pipe-to-pipe fuel flow distributions—that dictates combustion uniformity.
Achieving uniform burner-to-burner stoichiometries involves matching available fuel and air flows. Often there are limitations within the windbox due to either the original design or modifications that do not permit equal quantities of secondary airflows to each individual burner. Therefore it is possible for some burners to be more sub-stoichiometric than others even with balanced pipe-to-pipe fuel flow distributions and air registers at 100% open. This situation can often lead to increased carbon monoxide, opacity, and flyash loss on ignition (LOI) emissions as well as localized furnace slagging and other operational concerns.
Managing Uniformity
These concerns were challenges for one of SAS Global Corp.’s (SAS’s) clients. The unit is a Babcock & Wilcox wall-fired design. It has four EL-64 mills, and each mill has three burner lines. It is capable of approximately 95 MW net while firing an eastern coal. The unit is air-limited due to restrictions on its induced draft (ID) fan during warm weather. The unit has 12 ACT-modified burners and an overfire air system.
SAS was contracted to improve the unit’s combustion, lower its carbon monoxide (CO) emissions, and reduce flyash LOI while not increasing nitrogen oxides (NOx) emissions. To do so, SAS applied its Total Solutions Approach (TSA) to combustion optimization. The SAS TSA involves three phases. Phase I is an as-found assessment of the existing combustion characteristics, including pulverizer performance. Phase II involves installing equipment and upgrades (as required) backed by a 100% customer satisfaction guarantee. Phase III is optimization of the combustion with the equipment.
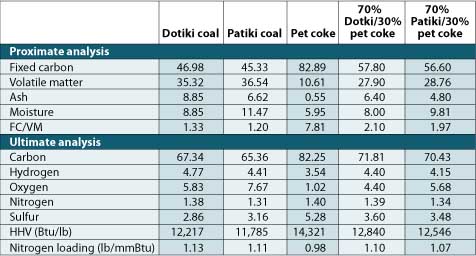
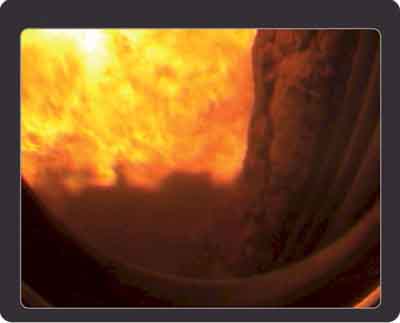
The results from Phase I indicated significant pipe-to-pipe fuel flow maldistributions, as shown in Table 1. In addition, high-temperature video recordings of the burner flames indicated significant non-uniform combustion with coal streaking and uneven ignition points (Figure 1).
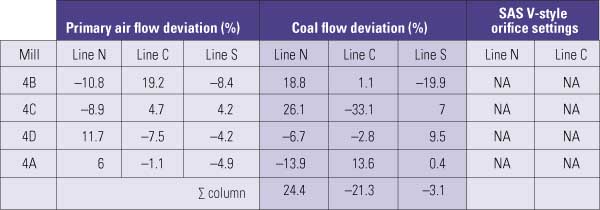
Table 1. As-found primary air and fuel flow variation. Source: SAS Global Corp.

1. High-temperature video recordings of the burner flames indicated significant non-uniform combustion with coal streaking and uneven ignition points in the as-found boiler condition. Courtesy: SAS Global Corp.
The burner in this figure had two distinct characteristics. First, the side closest to the camera had a pronounced coal streak. This is caused by a fuel-rich and air-lean condition, which produces much more CO and LOI than would be seen with a well-mixed flame. Second, the opposite side was fuel lean and air rich, which produced more NOx than would be realized with a well-mixed flame. In essence, this is the worst case for any burner.
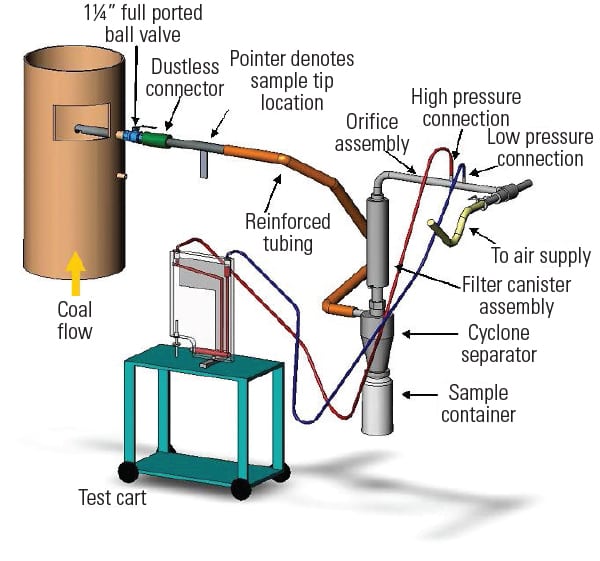
Based upon these Phase I results and observations, the plant decided to install the patented SAS V-Style adjustable orifices and patented in-line diffusers (ILDs). The V-style orifices allowed tailoring of the pipe-to-pipe fuel flow distributions with the mills in service. Further, the results of these adjustments could be seen immediately using the MIC-One, a real-time, microwave-based, portable coal flow measurement system.
The ILDs promote increased fuel and secondary airflow mixing because they break up any heavy coal concentrations (roping or streaking) as the fuel enters the burner. Other benefits of the SAS ILDs include more uniform wear of internal burner equipment, such as the burner barrels. The increased mixing allows for more uniform combustion with lower excess oxygen (O2) levels for lower NOx emissions.
Additional components for Phase II included optimization of the operating primary airflow curves and adjusting the classifiers for proper fineness of approximately 99.0% to 99.5% passing 50 mesh and approximately 72.0% to 75.0% passing 200 mesh.
Collecting Data
Testing began with using only SAS V-style orifices to determine balanced pipe-to-pipe fuel flow deviations (Table 2). The results indicated that the overall variations were greatly reduced to within approximately ±6.3% from approximately ±33.1% for mill 4C. More important was the significant reduction in the column-to-column fuel flow variation, with all variations within ±1.5% of the as-found variation of approximately ±24.4%.
Table 2. Balanced primary air and fuel flow variations. Source: SAS Global Corp.
There was also marked improvement in the appearance of the flames. Figure 2 is typical of the other burners, and it shows as a well-mixed plume without any coal streaks and uniform ignition within the burner throat.
2. After tuning the coal pipe flows, a well-mixed plume without any coal streaks and uniform ignition within the burner throat was observed. Courtesy: SAS Global Corp.
Once the SAS equipment was installed, Phase III (combustion optimization) began. Combustion optimization focused on balancing the individual burners’ stoichiometries using only the individual burner’s single air register. Figure 3 presents the as-found emission contour plots for this unit.
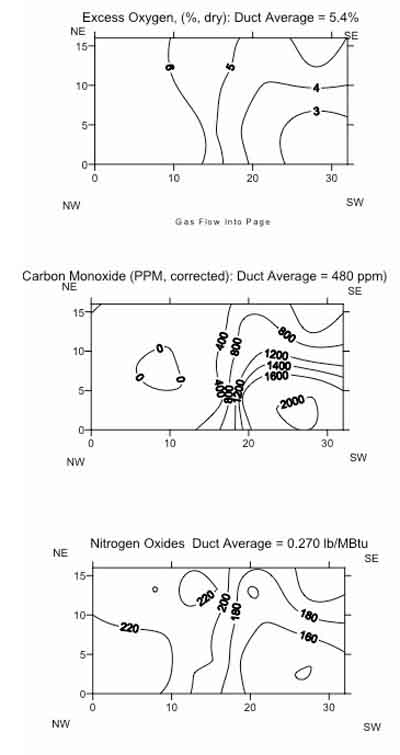
3. Test 01 was to establish the as-found condition, July 10, 2008. Gas flow direction is perpendicular into the figure. Source: SAS Global Corporation
In Figure 3, the economizer exit plane is replicated three times with the concentrations for excess O2 (top), CO (middle), and NOx (bottom) displayed as contours. The goal is to reduce the contours for each plot to as few as possible because fewer contours translate into better combustion uniformity. The results indicate that CO emissions are concentrated along the south side, with corresponding lower excess O2 and NOx in the same areas, Therefore, the south area is fuel rich and air lean, while the north part of the furnace is more fuel lean and air rich.
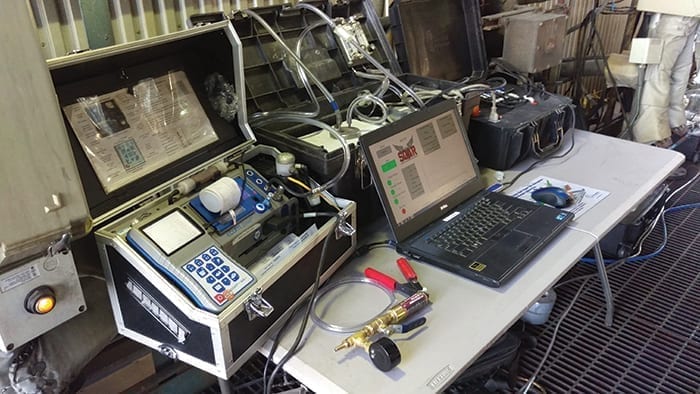
A series of combustion diagnostic and optimization tests followed. These tests were performed using the proprietary SAS Multi-Stream Combustion Diagnostic Analyzer (MSCA). The MSCA has the ability to sample up to 18 independent flue gas streams simultaneously and in real time. The data and results are collected using a laptop computer, and the software corrects for dilution. It is possible to investigate many cause-and-effect relationships much more quickly with the SAS MSCA than with traditional point-to-point sampling.
As an example, consider a test grid of 24 sample points. A traditional point-to-point approach would require at least 120 minutes to obtain five minutes of data per point. The MSCA would perform the same sampling in only 10 minutes. This speed helps ensure that all data are representative of the actual test condition, because it is not uncommon for a furnace’s combustion and emission to change within two hours due to slagging and other heat transfer changes.
Reviewing Test Results
Results of the optimization efforts with balanced pipe-to-pipe fuel flow distributions are presented in Figure 4. They indicate that the contours have decreased, but a “bull’s eye” is still present on the CO and O2 contours. This “bull’s eye” represents one single burner producing CO emissions in excess of 1,400 ppm. The corresponding burner register was set at 100% open. Hence, no more secondary airflow could be added or forced to this burner by closing other burner air registers.
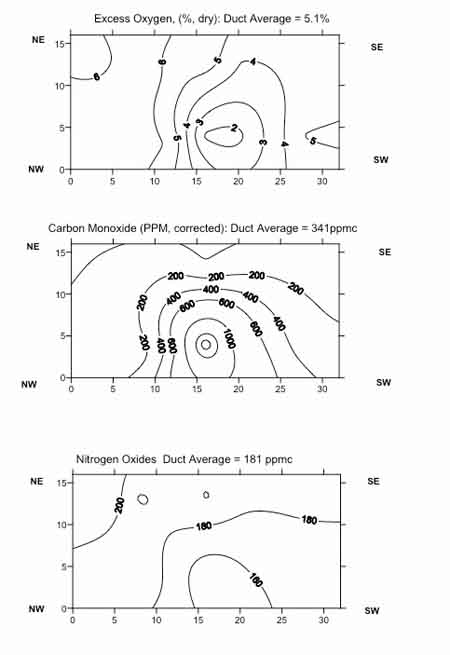
4. Test 15 used optimized air registers and balanced fuel flows. The test was conducted on August 19, 2008. Gas flow direction is perpendicular into the figure. Source: SAS Global Corp.
The only remaining avenue to optimize the combustion was to change the pipe-to-pipe fuel flow distributions for the lower two firing elevations, which are for Mills 4A and 4D. The approach was to slowly adjust one V-Style orifice at a time and then optimize the burner’s stoichiometry with revised air register changes. This process was iterative but effective, as seen in Figure 5. Figure 5 presents the results with many fewer contours, but a CO pocket is still present at the same relative location. The V-style orifices could not be closed any further due to minimum velocity constraints within the burner lines.
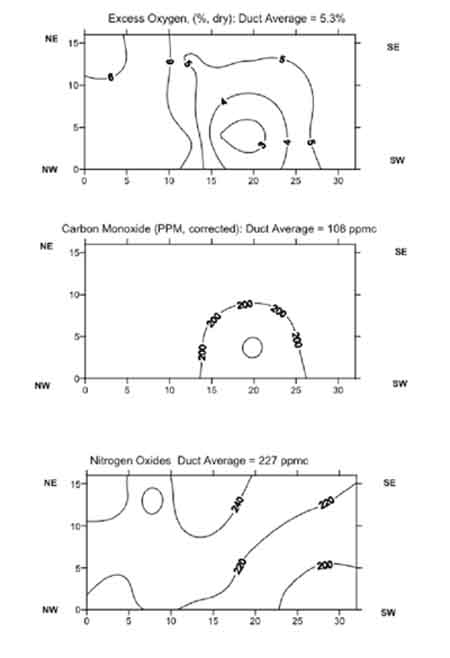
5. Test 20 on August 20, 2008. Optimized air registers with adjusted fuel flows. Gas flow direction is perpendicular into the figure. Source: SAS Global Corp.
Improving Combustion
This case history indicates that it is more important to optimize combustion based upon local burner stoichiometries than balancing individual coal pipe air/fuel flow. The data and results indicate that it may be necessary to allow greater pipe-to-pipe fuel flow variations in order to optimize combustion with apparent windbox limitations. These efforts have allowed this unit to produce approximately four to five additional megawatts of power with reduced opacity, significantly lower LOI (approximately 19% as-found versus approximately 6% to 8% as-left), and much lower CO (480 ppm versus 108 ppm) at comparable NOx levels. The SAS TSA has also been applied to the other units at this station with similar or better results.
—Frederick P. Haumesser, PE (fossilenergy@alltel.net) is manager of combustion optimization for SAS Global Corp.