Analysts who spoke with POWER differ slightly on the numbers, but they all agree that U.S. demand for natural gas for power generation will continue to rise. Supply should not be a problem—domestic production is at record levels—and prices should remain low, prompting generators to build more gas-fired units as market forces batter coal and nuclear operators.
Natural gas surpassed coal as the dominant fuel for U.S. power generation in April 2015, and each source supplied about a third of U.S. electricity that year—a far cry from just a few years earlier, when coal-fired generation accounted for more than half of the nation’s electricity production.
Gas has continued to pressure coal, as gas prices have been relatively low thanks to soaring U.S. production from shale plays such as the Marcellus and Utica in the Northeast; the Permian, Eagle Ford, and Barnett in Texas; the Niobrara, mostly in Colorado; and the Bakken, mostly in North Dakota. The market-driven response to low gas prices has diminished demand for coal; environmental regulations also have contributed to its demise. The economic and regulatory landscape for power generators today increasingly favors natural gas, along with renewable energy sources such as solar and wind, above coal-fired and nuclear power.
Several energy analysts who recently spoke with POWER agreed demand for natural gas for power generation will continue to rise in 2018, and likely beyond, owing to continued low gas prices, ongoing retirements of coal (and nuclear) power plants, and the burgeoning supply of gas that has turned the U.S. into a net exporter of the fuel. The U.S. is currently the world’s largest natural gas producer, having surpassed Russia in 2009. Natural gas production in the U.S. has jumped from 55 billion cubic feet per day (Bcf/d) in 2008 to average 73.6 Bcf/d in 2017, according to the U.S. Energy Information Administration (EIA). In January, the EIA forecast dry gas output would jump another 6.9 Bcf/d this year, which would be the highest one-year production increase on record. Most of this natural gas—about 96% in 2016—is consumed domestically.
The analysts all said U.S. production of natural gas will outpace gas demand this year, even as demand increases—meaning power plants will continue to have an ample supply of the fuel. Two factors could alter the supply-demand balance: a colder-than-normal finish to winter and/or a hot summer.
A cold end to winter, with below-normal temperatures lingering into spring, would keep heating demand elevated, necessitating above-normal levels of gas being pulled from storage. Storage withdrawals were well above average in January, due to unseasonable cold across Texas and the Southeast, and bitter cold in the Midwest and Northeast, driving the level of working gas in storage more than 18% below year-ago levels, and almost 18% below the five-year average, according to the EIA.
A hot summer, the season in which consumption of gas from the power sector is highest as electricity customers turn on air conditioners, would also impact demand. But expectations are that even higher levels of gas power burn across the rest of 2018 would not drive gas prices high enough to cause a market shift.
Growth in Power Burn
Luke Jackson, a senior energy analyst with S&P Global Platts, said his group’s 2018 forecast calls for about 1 Bcf/d of growth in power burn—or natural gas used for power generation—in 2018 compared to 2017.
“Our 2018 forecast right now is about 26.2 Bcf/d,” Jackson (Figure 1) told POWER. “We’ve seen very strong burns to start the year despite $3 gas. I think the elevated burn speaks to the structural shift that has happened across the country from coal to gas, making gas burn less sensitive to higher gas prices. Another 14 GW of coal [generation capacity] will retire by the end of 2018, so this will further support gas burn.”
 |
| 1. Elevated gas burn a “structural shift.” Luke Jackson, a senior energy analyst with S&P Global Platts, said power generation from natural gas has become less sensitive to gas prices, as more gas generation comes online and more coal-fired generation capacity is retired—a “structural shift” in generation. “Another 14 GW of coal will retire by the end of 2018, so this will further support gas burn,” Jackson said. Courtesy: S&P Global Platts |
Jack Weixel, vice president of the demand group for PointLogic Energy, which provides fundamental market data for the oil and gas sector, said the cold weather that blanketed much of the country—including the abnormal cold in the Southeast and Texas—moved natural gas power burn higher in December 2017 and January of this year. Weixel (Figure 2) said his group saw average gas burn in the Lower 48 states of 26.9 Bcf/d in January, the highest level his group has ever recorded, topping the previous January high of 25.8 Bcf/d set in 2016. Weixel said PointLogic’s updated winter 2017/2018 forecast “calls for power burn to exceed last year’s winter levels by 2.2 Bcf/d.”
 |
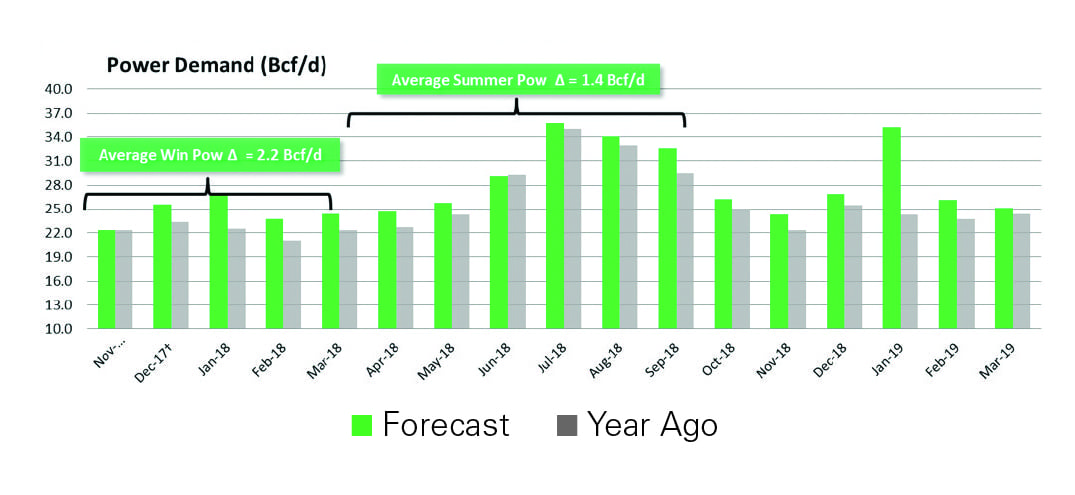
| 2. Summer power burn will top year-ago levels. Jack Weixel, vice president of the demand group for PointLogic Energy, said power burn this summer will average about 29.8 billion cubic feet per day (Bcf/d), or 1.4 Bcf/d above summer 2017. He said the increase “will be driven by slightly lower prices” for natural gas. Courtesy: PointLogic Energy |
Weixel told POWER that summer power burn (Figure 3) also will be higher than a year ago. “Summer 2018 power burn will average about 29.8 Bcf/d, or 1.4 Bcf/d greater than summer 2017 power burn levels,” Weixel said, noting PointLogic’s analysis assumes normal weather. “Despite some cold weather-related volatility in the spot price for natural gas, the relatively steady futures price of gas is important as we look further out in the forecast. The increase in power burn this summer will be driven by slightly lower prices [for natural gas] relative to last summer, in the $2.90/MMBtu range, and greater installed baseload [generation] capacity.”
 |
| 3. Higher and higher. PointLogic’s forecast for gas demand from the power generation sector expects levels in 2018 and early 2019 will surpass 2017 (year ago in the chart) marks. PointLogic’s analysis assumes normal weather. Courtesy: PointLogic Energy, Two Season Natural Gas Supply and Demand Balanced Forecast |
PointLogic expects that overall 2018 power burn will average 27.9 Bcf/d, which is 1.9 Bcf/d greater than the 2017 average and 0.3 Bcf/d greater than the 2016 average of 27.6 Bcf/d, the current record for average natural gas power burn in a calendar year.
Weixel said his group’s storage forecast (Figure 4) “changed dramatically” due to the cold weather in January that brought record withdrawals. “We have lowered our end-of-season carryout number by 415 Bcf, to 1,304 Bcf,” he said. “Should another extreme cold event roll through the Lower 48—and mid-range weather forecasts say that below-average weather for the balance of winter is possible—this number could trend down even further.” Weixel noted that the high levels of gas for power generation, along with residential and commercial (res/com) and industrial demand (for manufacturing and heating) for natural gas, could leave January 2018 as the high-water mark for monthly U.S. natural gas demand since levels have been tracked.
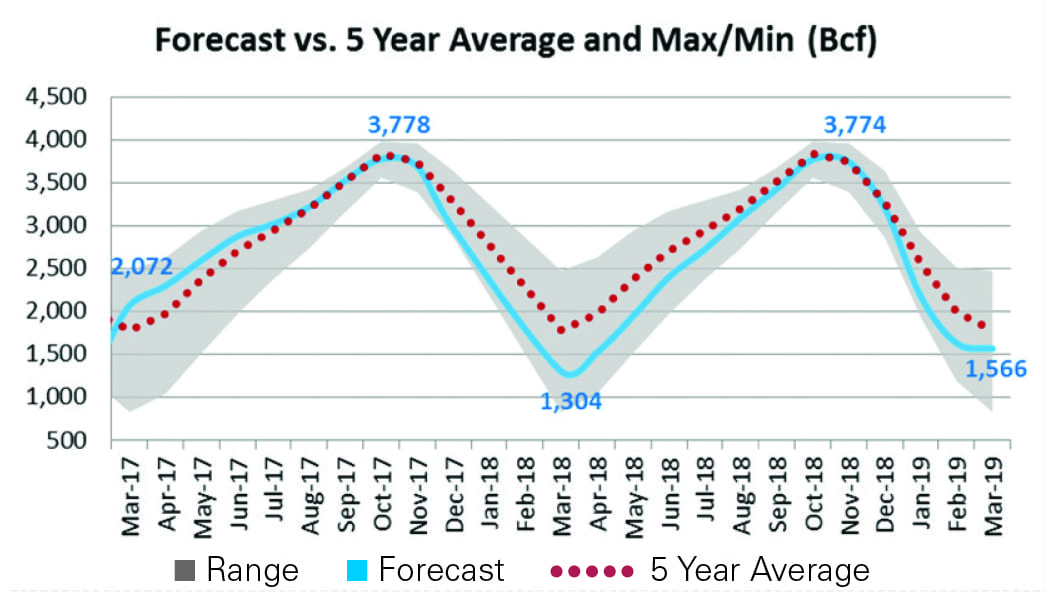 |
| 4. Working natural gas in storage. PointLogic’s chart shown here compares the group’s forecast for working natural gas in storage to the five-year average, and maximum and minimum levels from March 2017–March 2019. Cold weather across much of the U.S. in January led to record withdrawals from the storage inventory, lowering the forecast for storage levels at the end of the current winter season. Courtesy: PointLogic Energy, Two Season Natural Gas Supply and Demand Balanced Forecast |
Still, he said production will keep up. “Dry production this summer is forecast to average 79.4 Bcf/d, or 6.9 Bcf/d higher than summer 2017 levels,” Weixel said, noting how the increased price of crude oil has led to more drilling, which has increased production of associated gas, particularly in plays such as the Permian in Texas; the South Central Oklahoma Oil Province (SCOOP); and Sooner Trend Anadarko Basin, Canadian, and Kingfisher Counties (STACK) in Oklahoma.
EIA: Three States Paint Supply/Demand Picture
The EIA in a recent energy outlook report said that while demand for natural gas for power generation has continued to grow in many areas, three states—Ohio, Pennsylvania, and West Virginia—provide good examples of how both natural gas production and consumption have increased. Production in the three states has jumped from a combined 1.4 Bcf/d in 2008 to almost 24 Bcf/d in 2017; the three states’ combined share of U.S. natural gas production has risen to 27%, compared to just 2% a decade ago. Production increases are the direct result of the states’ being in the heart of the Marcellus and Utica shale plays, which in recent years have transformed the landscape for U.S. natural gas production.
Natural gas consumption in those three states has grown from 0.5 Bcf/d to about 1.9 Bcf/d over the past decade, according to EIA, with almost all the increase attributed to electricity generation. Numerous additions of gas-fired generation capacity, either by converting coal plants to burn natural gas, the construction of new gas-fired plants, and the retirement of several coal plants across the region has contributed to the rise in gas-fired output.
Ohio is at the forefront of the switch from coal to gas; the state has plans to add at least a dozen gas-fired power plants in the next several years, though some developers are waiting to see whether the state’s lawmakers come up with a plan to subsidize Ohio’s struggling coal and nuclear plants before committing to building gas-fired units. Energy companies with coal and nuclear assets in the state have lobbied the state legislature for help; thus far those efforts have failed.
“We have all this natural gas in the ground,” Ohio Gov. John Kasich said recently, discussing the state’s move toward gas-fired power generation. “If we don’t take advantage of it, what’s the point of having it?”
Two large natural gas-fired plants recently came online in Ohio. The 700-MW Carroll County Energy plant, which connects to the grid via an American Electric Power Co. 345-kV transmission line, and receives its gas supply from the Tennessee Gas Pipeline system, began service in December 2017 and sells power into the PJM Interconnection.
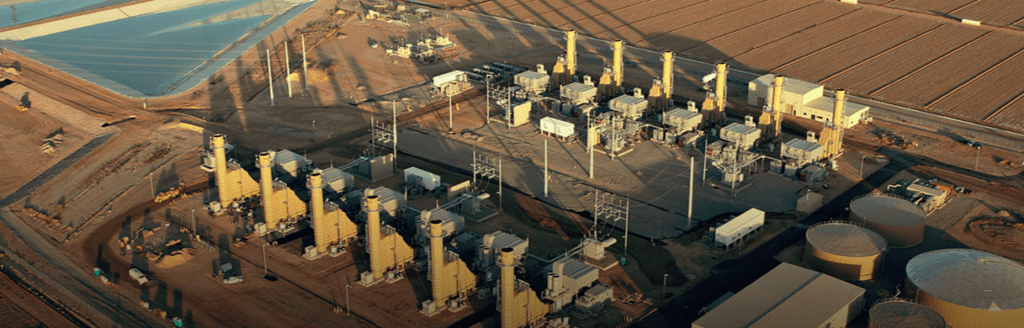
The Oregon Clean Energy Center plant (Figure 5) near Toledo entered service last summer. The 870-MW plant, developed by CME Energy and the North America Project Development group through Boston, Massachusetts-based Clean Energy Future (CEF), sits next to the proposed site of a 955-MW gas-fired plant, the Oregon Energy Center, which also is being developed by CEF.
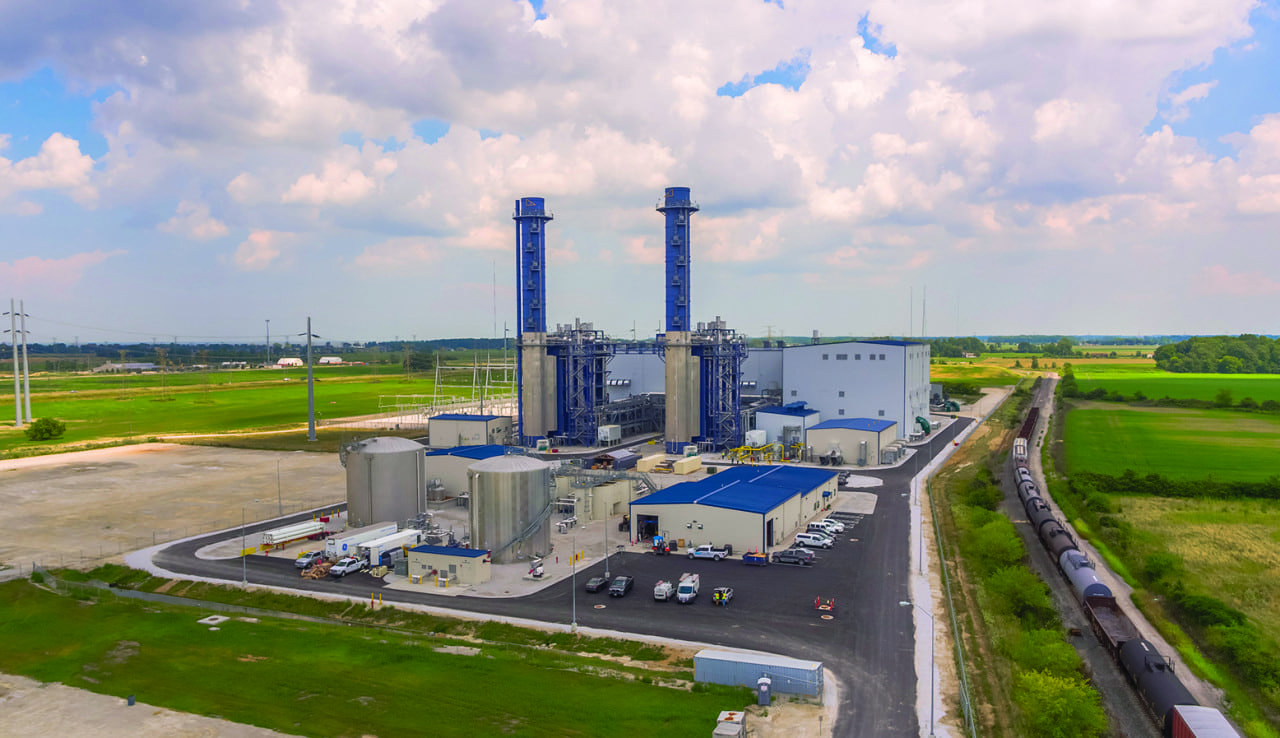 |
| 5. Ohio building new natural gas plants. Several new natural gas-fired power generation units have been proposed in Ohio, and one of the larger projects—the Oregon Clean Energy Center—already is operating. The 870-MW plant, in Lucas County east of Toledo, came online last summer. A 955-MW natural gas-fired plant has been proposed for the same area. Courtesy: Oregon Clean Energy |
Pipelines Change Traditional Flows—and Prices
EIA noted that natural gas prices in 2017 at key regional trading hubs were less volatile than in previous years, as pipelines that came online throughout the year eased infrastructure constraints that affect regional prices. Appalachia, which includes West Virginia and Pennsylvania, continued to narrow price differences between Henry Hub—the natural gas trading center in Louisiana that is the physical delivery point for the New York Mercantile Exchange (NYMEX) futures contract—and nearby trading hubs in the Northeast, because of the significant increase in production in the region.
“Natural gas prices will be critical to establishing power demand for the upcoming summer,” said Willis Bennett, president of Colorado-based ecomenergy.com. Bennett told POWER the run-up in prices early this year came due to the abnormal cold, and weather forecasts that predicted cold weather could continue, along with the “sizeable withdrawals from storage during the early winter, and most importantly a large amount of short covering from the speculative sector during January.”
Bennett said the recent actions of natural gas traders “illustrate the market’s knowledge of the significant rise in dry gas production—over 5 Bcf/d [higher] this winter—and it now averages over 77 Bcf/d on a weekly basis. This level of growth will likely leave the market ‘comfortable’ with ending [storage] inventories around 1.4 TCF (trillion cubic feet) at the end of March, mitigating the early season’s substantial withdrawals’ impact.” Bennett said prices likely will fall low enough this summer to “have a dramatic impact on power demand from natural gas, as a NYMEX exchange price of $2.20 (per MMBtu) places many of the delivery zone prices under $2, and puts natural gas in an extremely competitive position as a fuel supply for power generation.”
Bennett and the other analysts noted how the increased supply of natural gas in the Northeast, as noted earlier, has been able to meet demand in that region, and pipelines now move gas south and east from Appalachia, narrowing regional price differences that were wider a few years ago, when U.S. natural gas traditionally flowed from south to north, with pipelines carrying hydrocarbons from the Gulf Coast to the Northeast.
Infrastructure: New Gas Plants Replacing Retired Coal Units
Vitaliy Krasko (Figure 6), an energy market analyst at DrillingInfo, a data and analytics shop for the oil and gas industry, told POWER his group expects “gas demand from the power sector to increase this year compared to last (Figure 7), and one driver of that is our expectation of lower prices. Last year’s Henry Hub contracts settled at $3.11 on average, while this year we are expecting closer to $2.85 on average.”
 |
| 6. Lower prices, more demand. DrillingInfo energy market analyst Vitaliy Krasko agrees with other analysts who say gas demand for power generation will rise in 2018. “One driver of that is our expectation of lower prices,” he said, noting Henry Hub contracts are expected to average 26 cents/MMBtu lower in 2018 than a year ago. Courtesy: DrillingInfo |
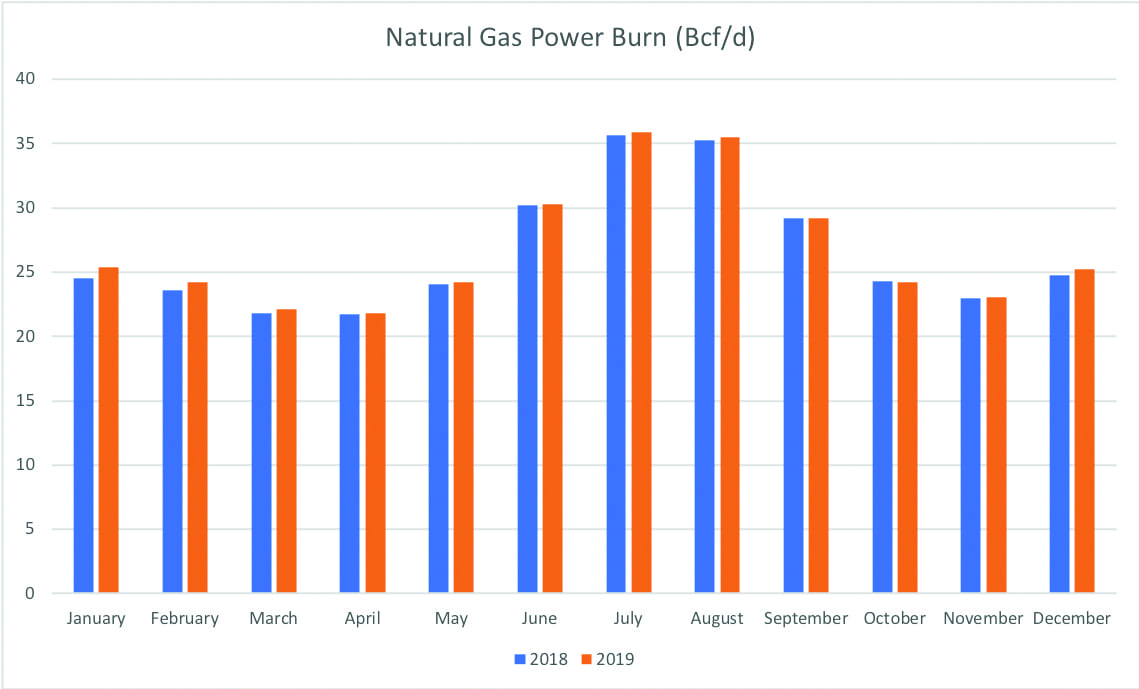 |
| 7. Soaring demand this summer. DrillingInfo expects gas demand for power generation will top 35 Bcf/d in both July and August this year. Demand for gas to generate electricity is typically highest during the hottest months, as air conditioners run at all hours in many areas. It’s also the time of year when many peaker plants, which are usually fueled by natural gas, come online to help meet the higher demand for power. Courtesy: DrillingInfo |
Krasko also said, “Infrastructure trends will also help, as more natural gas-fired plants come online and more coal plants retire. Company announcements indicate about 12 GW of coal set to retire this year and another 1.2 GW is switching fuels. Of that total, 5.3 GW is retiring in Texas, 2.4 [GW] in Ohio, and 2.3 [GW] in Florida. That amount of retirements in Texas is unprecedented—less than 1 GW of coal has retired [in Texas] in the past decade.”
The EIA report in January noting increased power generation from natural gas in Ohio, Pennsylvania, and West Virginia, came on the heels of a December news release from the agency that discussed how natural gas provides most of the electricity generation in the southern U.S. The agency said southern states got 42% of their power from natural gas in 2016 (the latest data available), above the overall U.S. 2016 average of 34%. The EIA also noted that coal’s share of total electricity generation in the South dropped from 50% in 2006 to 29% in 2016.
EIA said natural gas generation has outpaced coal-fired power for more than a decade in Texas, Oklahoma, Louisiana, and Arkansas, and in 2015 gas overtook coal along much of the East Coast, including Florida. The agency said “more coal-fired generating units were retired in the South between 2006 and 2016 than units fueled by any other fuel type, with 20.8 gigawatts (GW) of capacity taken offline during that period.” The group said just “9.6 GW of coal capacity was added between 2007 and 2013, [and] no coal units have been installed since 2013. New installed capacity in the region came primarily from natural gas and wind, with an additional 47.0 GW and 25.6 GW installed, respectively, between 2006 and 2017.”
And Krasko noted three long-time, coal-burning states are at the forefront of adding gas-fired generation. “The states with the largest gas buildouts for 2018 would be Pennsylvania [5.8 GW], Ohio [3.5 GW], and Texas [2.9 GW],” he said. “Wind and solar will continue to grow, creating a headwind for gas, but we expect the net effect of infrastructure changes to be positive [for gas].” ■
—Darrell Proctor is a POWER associate editor.