Scientific debate on the validity of global warming science continues, but the issue has yet had little impact on individuals. That impact is being negotiated in Washington, where a regulatory framework that would mandate reductions of greenhouse gases (GHGs) is taking shape. Legislative options under consideration would redefine what power plants must do-and not do-to provide "environmental protection."
Reducing GHG emissions (Figures 1 and 2) will affect all sectors of our economy and those of other countries as well. Never before has the U.S. electric power industry had to adopt such a global perspective while many industries and regulators are busy itemizing local contributions to global warming of every home, business, factory, power plant, and vehicle. Failure to understand the bigger picture could doom to failure any regulatory framework that emerges, taking a bite out of consumers’ budgets in the process.
1. What CO2 lacks in strength . . . Many gases are much more effective at trapping heat than CO2. The global warming potential (GWP) of these greenhouse gases measures their contribution relative to that of CO2, which is assigned a GWP of 1 for reference. Note the log scale. Source: 2001 Intergovernmental Panel on Climate Change Report

2. . . . it makes up for in volume. Source: U.S. Energy Information Administration
This article discusses the likely impacts of mandatory carbon controls on existing and future U.S. power generation infrastructure. For perspective, we begin by comparing America’s CO2 emissions profile to other nations’. Then we examine how the electric power sector’s strategies for coping with carbon caps might differ from those of other major economic sectors.
U.S. vs. them
America is indeed the largest CO2 emitter per capita of any large nation. The average U.S. citizen produces almost four times the world average level and more than double what the average European produces (Figure 3). One observer noted that, though both U.S. and European emissions appear to be stable, we are actually "exporting" CO2 emissions by moving industries that produce lots of the gas (for example, cement, aluminum, steel, and fertilizer) to developing nations, where raw materials, labor, and energy are less expensive.

3. We’re No. 1. Levels and trends of per-capita CO2 emissions. Source: U.S. Energy Information Administration
Although per capita CO2 emissions aren’t rising rapidly anywhere, total worldwide emissions are, led by China and India (Figures 4 and 5). Every week to 10 days, China builds another coal-fired power plant big enough to power a midsize city in the U.S. China’s addiction to coal helps explain why the U.S. Senate unanimously rejected the Kyoto Protocol in 1997.

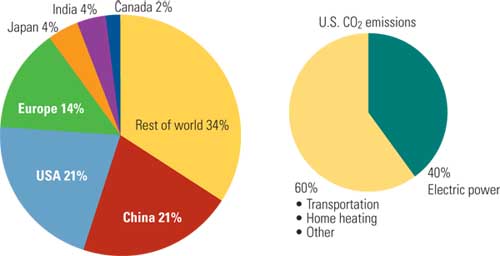
4. Who let the CO2 out? Sources of anthropogenic (man-made) CO2 emissions by continent. Source: U.S. Energy Information Administration
5. Men at work. Worldwide anthropogenic CO2 emission trends with a 1990 base year. Note the recent acceleration in output by Asia and Oceania, representing mostly Chinese and Indian industrialization. Source: U.S. Energy Information Administration
Elsewhere, after European CO2 emissions peaked in 1990 (the protocol’s baseline year), the arrival of capitalism in Eurasia (the former Soviet Union and its satellites) helped keep them down. By the time the Berlin Wall fell, almost all of the coal-fired plants in Eastern Bloc countries were quite decrepit as a result of long neglect. But with the early-1990s flood of foreign investment in Russian gas and gas pipelines, economics dictated the replacement of much of Eurasia’s coal-fired capacity by gas-fired combined-cycle plants. By 1998 the region’s CO2 emissions had dropped by more than 1,500 million tons per year. The initial targets under the Kyoto accord required an amount similar to what was already being achieved.
Distributed emissions
Figure 6 breaks down U.S. CO2 emissions by economic sector and fuel consumption. Obviously, the two biggest targets for CO2 reduction are coal burning by the electric power sector and petroleum consumption by the transportation sector. Figure 7 is one that everyone in the power sector appreciates, because it shows what Figure 6 would look like if power plants’ CO2 emissions were attributed proportionally to the sectors that use their product: electricity. It more clearly identifies the impact that targeting each sector’s emissions would have on reaching a national CO2 reduction level.

6. Fuel diversity. This chart breaks down U.S. CO2 emissions by economic sector and fuel consumption. Source: U.S. Energy Information Administration
7. Spreading the blame. Here’s what Figure 6 would look like if the electricity sector’s CO2 emissions were attributed to the sectors that use its output: electrical energy. Source: U.S. Energy Information Administration
The remainder of this article reviews the emissions reduction strategies that are likely to be implemented or pursued in each of the five major economic sectors. (Since this is POWER magazine, the section on the electric power sector is the longest.) As you read, consider the impact that a mandatory federal GHG and/or CO2 reduction standard would have on companies in each sector, relative to companies in the others.
Residential and commercial (combined)
Investor-owned utilities (IOUs) have promoted demand-side management (DSM) programs for residential and commercial users for many years. Of course, some IOUs just go through the motions of promoting DSM because, at the end of the day, their revenues are determined by the number of kilowatt-hours sold. Every utility has a disincentive to invest money to reduce its heating and lighting load and associated revenue. That is, unless it is properly compensated by an enlightened state regulator. The lack of a federal DSM policy and the inconsistency of state policies have prevented many IOUs from having their investments in efficiency programs recouped by rate increases.
Basic DSM (in a total energy sense) for the residential sector includes small-subsidy programs for switching to compact fluorescent lightbulbs, installing programmable thermostats, planting shade trees, installing storm doors, and caulking windows. More aggressive programs can include federal or state low-interest loans, tax credits, and/or rebates for bigger-ticket items like heat pumps, photovoltaic panels, upgrading to Energy Star appliances (and retiring and recycling their energy-hungry predecessors, like that old beer refrigerator in the garage), and beefing up home insulation.
In the commercial sector, the current focus is on using energy-efficient design to gain LEED (Leadership in Energy and Environmental Design) certification for a building. The LEED requirement for all schools and government buildings is a natural outcome of the current energy-efficiency craze. Incorporating natural heating and cooling into a building’s architectural design is now standard practice in the commercial sector. So too is integrating design features that promote productivity and an enjoyable work environment.
For builders of larger, campus environments (such as apartment complexes, hospitals, and universities), the low-hanging fruit of the energy-efficiency tree is replacing the small energy heating and cooling systems serving individual buildings with one more-efficient combined heat and power (CHP) system. In Europe, especially its cities, where energy prices are higher than in the U.S., CHP facilities have been operated successfully for decades.
Industrial
Rising electricity costs continue to give power-intensive U.S. industries and companies good reason to relocate their factories overseas. Meanwhile, the "race to the bottom" in labor rates continues, driving manufacturers into countries with an even lower living standard than China (including the countries of Africa). To use China as an example, the cost of building an electricity factory (a power plant) there is one-fourth the cost of building one of the same size in the U.S.
It’s a foregone conclusion that the U.S. utility industry will never be able to reverse the industrial exodus by building power plants that can compete-either in capital or production cost-with plants in the developing world. In America (and Europe), both industrial and power plants are at a competitive disadvantage because they are saddled with mandated costs for environmental protection. If governments also require plants and industries to capture and sequester the CO2 they produce, there will be another race to the bottom. The winner will be the country with the most relaxed environmental standards.
The refusal (so far) by China, India, and other developing countries to consider mandatory CO2 reduction targets could eventually push the U.S. and Europe to impose a carbon tax on imports of commodities and finished goods from "polluters." China, India, and the rest will base their response to such a tax on a simple economic principle: Will it be cheaper to avoid the tax by installing CO2 capture and sequestration technologies (assuming their commercial availability) or to accept the tax as a "cost of doing business" with the developed world? In either case, developing countries will likely retain their economic attractiveness to worldwide industry, given their lower capital and labor costs and more-lenient air pollution standards.
Many of the non-CO2 GHG emissions sources (representing 16% of total CO2-equivalent emissions) in the U.S. are part of the industrial sector. New rules for air pollutants other than GHGs-with an assist from "corporate responsibility"-have driven many industrial firms to clean up their production act; in many cases the cobenefit has been a reduction in corporate GHG emissions. The steps that companies have taken include everything from instituting minor process redesigns to making use of the methane emitted by landfills. If GHG emissions are regulated, more companies will have more of an economic incentive to follow suit, in the form of valuable emissions credits.
Transportation
The primary means for addressing CO2 emissions from the transportation sector are the Corporate Average Fuel Economy (CAFE) standards. While other sectors of the economy are relatively centralized, the transportation sector has more than 240 million mobile sources. The popularity of hybrid vehicles-which don’t recoup their capital cost premium in fuel savings for many years, even with gasoline at $3/gallon-suggests that at least some drivers are willing to pay a little to be a bit greener.
President Bush’s proposal to reduce U.S. gasoline consumption by 20% over the next 10 years by raising the CAFE standards and expanding ethanol use seeks to simultaneously achieve three significant and distinct goals: improved national energy security, lower prices at the pump, and less CO2 released into the atmosphere.
Promise of these three benefits is already driving growth in ethanol production and could serve as incentive to develop a U.S. coal-to-diesel industry. But CO2 capture and disposal challenges will be huge for coal-to-liquids production, because its most mature technology-invented in Nazi Germany during the 1940s and refined by South Africa over subsequent decades-generates even more of the greenhouse gas than generating electricity from coal.
Although raising CAFE standards, now at 27.5 mpg, would bring the U.S. in line with Europe (45 mpg now) and China (38 mpg now, and 43 mpg in 2008), politicians are reminded daily that every source of CO2 in the transportation sector is driven by a voter. The April 2007 Supreme Court decision that the Environmental Protection Agency has the authority to regulate heat-trapping emissions from vehicles created a viable path to implement national CO2 standards for cars and trucks with minimal political recourse.
Electric power
Aside from reducing demand from residential and commercial users, the U.S. electric power sector has three primary GHG-reduction strategies in its arsenal:
- Increasing supply-side efficiency.
- Building more nonemitting sources.
- Capturing and sequestering CO2.
Supply-side efficiency. The power sector continues to find ways to minimize its raw material (fuel) costs by increasing generation efficiency. For example, the average heat rate of gas-fired power plants has fallen 18% since 1996, largely as a result of the mothballing of older, gas-fired steam plants and their replacement by more-efficient combined-cycle systems powered by combustion turbines (Figure 8). Some of this gain in overall efficiency may be reversed over the next several years as a consequence of steep load growth in the Gulf Coast region that may necessitate returning the idled units to service.

8. Efficient consumption. The average efficiency of U.S. natural gas-fired power plants has improved nearly 18% over the past decade. Source: U.S. Energy Information Administration
Already high and still rising natural gas prices will drive many utilities to consider replacing some of their less-efficient combustion turbines and boilers with state-of-the-art energy conversion systems. Doing so would allow them to generate additional power with no increases in fuel consumption or polluting emissions.
Advances in steam turbine blade materials and design allow utilities to significantly improve coal plant heat rates via retrofit upgrades. But as some utilities have discovered, improving efficiency in this way could trigger a New Source Review. Numerous efficiency projects have been put on hold or scrapped, pending the outcome of rulings that would eliminate their litigation risks.
The simplest and fastest way for utilities to reduce their CO2 emissions is to replace inefficient coal plants at the end of their lives by gas-fired combined-cycle units. Burning gas rather than coal, plus the efficiency gained by switching to combined cycles, can reduce CO2 emissions per megawatt-hour by up to 60%.
This strategy, however, must take into account the very real risk of high natural gas price volatility. Although higher gas prices reflect increased demand for the fuel, they have not been accompanied by a comparable increase in supply, in the form of increased domestic production. Importing more liquefied natural gas (LNG) could fill the gap, but doing so would do nothing to improve America’s energy security because most LNG-exporting nations are either unfriendly to the U.S. or politically unstable. Countries like Japan, which relies almost entirely on imported energy, recognize the importance of using national policies to increase generation-fuel diversity and thereby improve national energy security.
The electric power industry’s efficiency strategies have recently been criticized by special interest groups that have shown greater willingness to intervene in plant licensing and permitting processes. By questioning whether proposed plants’ heat rates are low enough, the groups hope to foster construction of a more environmentally friendly generation of central stations. In regions with limited water resources, the battle is typically between local interests that favor the use of dry cooling and national interests with a stake in promoting the use of advanced technology to improve plant efficiency. This argument even spills over into the choice of an air quality control system technology for a new or old plant: a wet or a dry scrubber. There are also competing interests within and between special interest groups about their environmental goals; some are concerned only with CO2 reduction and increased generation efficiency, while others accept some efficiency loss in order to target a particular environmental issue. One good example is demanding dry flue gas desulfurization and air-cooled condensers to reduce water usage.
Nonemitting sources. Even some environmentalists now support building a new generation of nuclear power plants because reactors produce zero emissions of CO2, other GHGs, and other conventional pollutants. Yet other environmentalists remain as intransigent as ever: One anti-nuclear group recently published a report that purported to demonstrate that a nuclear plant’s emissions should include those produced during the manufacture of its steel and concrete and the mining and processing of its uranium fuel.
Nevertheless, the uncertain timetable for opening the Yucca Mountain facility for storage and disposal of spent radioactive fuel remains a significant barrier to new nuclear plant development. Utilities considering investing billions in a new nuke also face unquantifiable risk of liability for any nuclear "accident," even a minor one such as a tornado scattering a few gallons of "hot" water from a spent-fuel pool. The media frenzy that such an event would produce could strand billions of dollars of utility investment in unfinished projects. Regardless, the life extensions recently obtained for most existing nuclear facilities in the U.S. run out between 2025 and 2035. Because additional extensions are not likely, the industry will have to find a way to replace more than 100 units that represent about 20% of America’s baseload generating capacity.
Like nuclear plants, hydroelectric plants have seen their inherently low production costs offset by extremely high siting and licensing costs. New hydro facilities will be extremely difficult, if not impossible, to permit in the future.
Wind and solar will play a significant role in meeting the renewable portfolio standards enacted by a number of states. Unfortunately, because these power sources can’t be reliably dispatched, their usefulness is limited to reducing the fuel costs and emissions of a utility’s portfolio. Two other issues that will prevent wind and solar from going mainstream are their poor economics and capacity factors. For wind farms, a third issue is aesthetics. Because many find large wind turbines unsightly (apparently, only engineers can see beauty in power facilities), they will increasingly be sited offshore and on open plains. Finally, if Congress again fails to extend the wind energy federal production tax credit, the industry will again shift from drive to neutral.
Biomass has recently been gathering momentum as the "fuel of the future." Cofiring of 5% to 10% biomass may be possible in existing coal facilities. But the many plants that have switched to Powder River Basin (PRB) coal are not amenable to cofiring because their output is already limited by PRB coal’s lower heat content. Furthermore, any large-scale production of biomass will have to compete directly with ethanol produced from corn or another feedstock, such as switchgrass. In years past, millions of acres of cropland were in government-sponsored set-aside programs. With expansion of ethanol production, this idle acreage will likely be put to use growing corn.
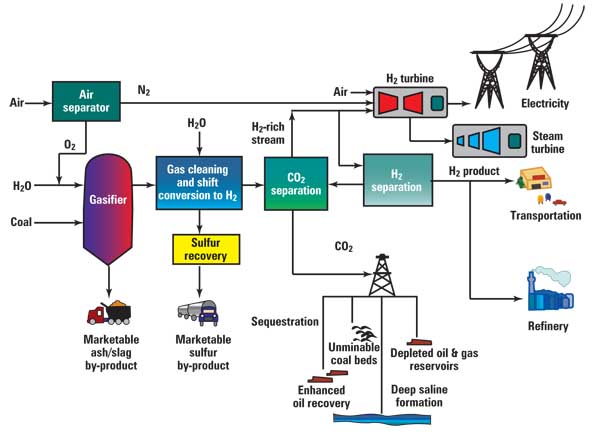
Capturing and sequestering CO2. It’s now clear that it will take decades, rather than years, to develop reliable CO2 capture and sequestration technologies. Until they are commercially available, integrated gasification combined-cycle (IGCC) plants will be limited to being "capture-ready." The April 2007 article in POWER titled "Exploring the many carbon-capture options" did a good job of summarizing the development status of various capture technologies. By comparison, technologies and schemes for sequestering the enormous volumes of CO2 that an IGCC plant will produce are much further behind.
Much of the current focus on sequestering CO2 is on using it for enhanced oil recovery (EOR), a technology with a long and successful track record. However, EOR will likely use only 10% (at best) of the CO2 produced by the electric power and industrial sectors, and that estimate assumes the deployment of a nationwide network of CO2 pipelines.
Ten percent is just not enough to make the business case for EOR. Although the first IGCC plant in a region may actually bring in revenue for several years by exploiting an EOR opportunity, the first excess ton of CO2 discharged into the local distribution system will dramatically change the economics of the entire CO2 stream going forward.
Oil and gas producers have spent many billions of dollars to understand the geology of underground fields. It will be very difficult, if not impossible, for electric utilities to become as knowledgeable. As a result, oil and gas companies will be able to charge generators whatever they want to sequester CO2, and the process will extend the life of their fields to boot. Federal ownership of leased fields may also require obtaining a "sequestration lease" in order to deploy non-EOR geological storage and provide a mechanism for long-term ownership of the sequestered product.
The "early adopter" power plant that initially realized a revenue stream from selling CO2 would now have to pay to dispose of its CO2, as waste. This transition would swing the economics of the facility’s pro forma by more than $30/ton of CO2 produced. The bill could be as high as $70/ton if a geological sequestration location requires significant infrastructure development. At this point, the early adopter facility’s dispatchability would be severely challenged.
The regulatory framework for geological sequestration has risks similar to those facing Yucca Mountain today. Pumping hundreds of millions of tons of CO2 under land that is below cities, national parks, schools, and homes will give pause to many. Though the true risks of geological sequestration will probably be statistically insignificant, public perception will cast the final vote on its acceptability.
For sequestration, the biggest risk to the electric power sector is a lack of legislative guidance and certainty (see box). It is likely that litigation will slow the development of a CO2 regulatory framework for decades. In this scenario, the utility industry will likely pay a king’s ransom to the oil and gas industry for assuming the long-term risks of geological sequestration. But for regulated utilities, their increased cost will be recouped by rate hikes that consumers will have no choice but to pay.
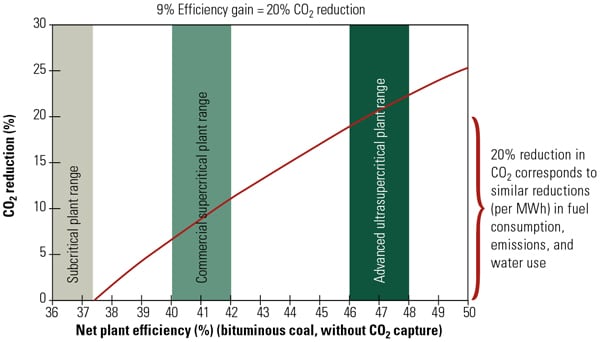
New permitting paradigms
A cost-effective approach to replacing the existing coal-fired fleet (which accounts for 50% of U.S. electricity production) with more-efficient plants is vital to maintaining U.S. economic strength. Replacing a 900-MW coal-fired unit with a heat rate of 11,000 Btu/kWh with another kind of generating technology that has an 8,800 Btu/kWh heat rate would reduce combustion-related emissions by 20%. If the new unit integrates mandated CO2 capture technology, operating the capture system would consume about 20% of the plant’s output. This would bump the net heat rate back up to 10,560 Btu/kWh and increase fuel costs 20%. These added costs, and potentially significant CO2 sequestration fees, would make the economics of dispatching such a unit so problematic that it would require "artificial" economic incentives to operate in baseload mode.
One way to minimize the unit’s economic disadvantage would be to allow its owner to bypass the capture system during periods of peak demand. Such a waiver would provide additional "spinning reserve" and reduce the need to invest in peaking capacity. To realize this benefit, the utility industry will have to take a fresh look at how CO2 emissions are to be permitted, vis-à-vis other criteria pollutants. For example, a 900-MW pulverized-coal (PC) facility could be permitted as "90% capture capable" and required to remove 75% of its annual CO2 emissions. Doing so would allow it to operate 1,300 hours per year in peaking mode.
This approach to permitting would be equally applicable to a PC plant with postcombustion capture and to an IGCC plant with an air-blown postcombustion capture system. The impact on postcombustion air quality control systems would likely limit any potential benefit for plants using an oxy-fuel capture approach. Similarly, the approach is not likely to be applicable to IGCC plants with shift-gas technology because it may require equipping the combustion turbine with dual-fuel combustors. For postcombustion capture technologies, permitted criteria pollutant emission levels would need to be based on non-CO2 capture system technologies alone, not on any emission reduction cobenefits that the CO2 capture system would provide.
Another important permitting consideration of the future will be a plant’s ability to handle a disruption in its sequestration system. For example, consider this hypothetical scenario. A group of citizens concerned that sequestered CO2 is contaminating their drinking water supply convinces a local county board to temporarily suspend sequestration pending a lengthy state and/or federal investigation. With nowhere to put its captured CO2, the baseload plant doing the sequestration has to shut down, devastating reserve margins in the region. This scenario exemplifies the many unintended consequences of insisting that specific power plants meet federal or state standards for CO2 emissions performance.
—Grant E. Grothen, PE is Burns & McDonnell’s GHG programs director. He can be reached at ggrothen@burnsmcd.com.