 |
| Courtesy: Ontario Power Generation |
By the end of 2013, one year ahead of its goal, the province of Ontario will be virtually coal-free—a first for a North American jurisdiction. How did the most populous part of Canada go from 25% to 0% coal-fired generation in just a decade, and what does this phaseout mean for the rest of the world?
A decade ago, the Canadian province of Ontario supplied one-quarter of its electricity from coal-fired power. In early January this year, the province announced that it would meet its goal of phasing out coal-fired generation a year early. By the end of 2013, coal-fired generation will be less than 1%, and 17 of the 19 units that existed in 2003 will be shut down; the remainder (backup units) will be eliminated by the end of 2014 (Table 1). The province’s Ministry of Energy calls the phaseout the “single largest greenhouse gas reduction measure being undertaken in North America.”
 |
| Table 1. Going, going, gone. This table shows the amount of coal-fired generation in the decade following the first efforts to phase out coal-fired power in Ontario. Schedules for 2013 and 2014 are projected. Atikokan and Thunder Bay Generating Stations are currently operated only as back-up reliability sources. Atikokan is being converted to biomass; the province’s Long-Term Energy Plan calls for converting Thunder Bay to burn natural gas. Note that when all eight units of Nanticoke were operational, it was the largest coal-fired power plant in North America, with a capacity rating of 3,964 MW, as well as the nation’s largest single source of greenhouse gas emissions. Sources: Ontario Ministry of Energy, OPA |
Rather than compromising the province’s power supply, decisions over the past decade regarding everything from supply to conservation to grid enhancements have resulted in an installed capacity that exceeds the province’s peak demand. According to numbers provided to POWER by the Ontario Power Authority (OPA), peak demand (July 13) in 2005 was 26,160 MW, while capacity stood at 30,662 MW. In 2012, peak demand dropped, to 24,636 (July 17), while capacity increased to 35,736 MW, giving the province an enviable surplus. That “healthy and stable supply is in contrast to 2003, when Ontario paid $900 million importing power to meet the electricity demand of residents and businesses,” said OPA spokesperson Tim Butters. (All currency is in Canadian dollars unless the reference is to U.S. prices. U.S. and Canadian dollars were near parity in early 2013.)
Why Eliminate Coal?
Ontario’s population of 13,505,900 (as of July 2012) is 38.7% of Canada’s total. It is close in resident size to the state of Illinois, with which it shares a heavy reliance on nuclear power. Given that it is home to major population and business centers, Ontario cannot afford to be capricious when it comes to electricity supply availability and reliability decisions. So what prompted the major supply shift? Public pressure, legislative action, and fuel availability all played a role.
As in other regions and countries, public pressure for cleaner, renewable energy sources started the ball rolling. The Ontario Clean Air Alliance (OCAA) coalition, established in 1997, was the primary public interest group to bring pressure on politicians and industry to make a shift to cleaner energy. The alliance consists of “approximately 90 organizations (health and environmental organizations, faith communities, municipalities, utilities, unions and corporations) that represent over six million Ontarians.”
Pressure from the OCAA is seen as having been instrumental in nudging politicians to consider a coal-free diet. (It should be noted that although the group’s name focuses on clean air, the OCAA also calls for a phaseout of nuclear power and emphasizes the opportunities for efficiency, renewables, importing hydropower from Quebec, and small-scale gas-fueled combined heat and power projects.)
Then, in August 2003, the eastern North American blackout got everyone paying attention to the grid. Ontario’s response included creating an Electricity Conservation and Supply Task Force (ECSTF), which recommended developing a long-term plan for generation and conservation. That fall, the provincial government followed ECSTF recommendations and enacted the Ontario Electricity Restructuring Act, which, in part, created the Ontario Power Authority, whose responsibilities include addressing power system planning issues.
Divesting the province of coal was seen as a way to meet multiple goals: fight climate change by reducing greenhouse gas (GHG) emissions, reduce smog and mercury and other emissions to protect human health, and develop more renewable/free-fuel generation sources. The relative emphasis given to each of these rationales depended on which group was making the pitch.
Fuel prices and availability played a less-critical role. Most of the coal for power generation had been imported from the U.S., whereas gas for power generation comes from western Canada.
How Ontario Switched Off 25% of Baseload Generation in a Decade
Eliminating a quarter of dispatchable baseload generation in 10 years is no small feat for any sizable power grid. The short answer to the question of how Ontario has been able to achieve this is that it has had a provincial government responsive to pressure applied by the public, including the OCAA, and a hybrid energy infrastructure ownership and control system that enabled smooth execution of the plan—once it was developed and as it was modified.
Government Backing. The Ontario Ministry of Energy has legislative responsibility for the following entities:
- The Independent Electricity System Operator (IESO), the grid operator.
- Hydro One, a provincially owned company that operates the majority of Ontario’s transmission lines and serves as a local distribution company in some areas of the province.
- The Ontario Energy Board (OEB), an independent adjudicative tribunal responsible for regulating Ontario’s natural gas and electricity sectors. Part of the OEB’s mandate is to protect the interests of consumers with respect to prices and the reliability and quality of electricity service.
- The Ontario Power Authority, an independent crown corporation (a hybrid government/private entity that is owned by the government but operates at arm’s length—comparable to “federal government chartered and owned corporations” like Tennessee Valley Authority in the U.S.) that works to develop a reliable, cost-effective, and sustainable electricity system in the province.
- Ontario Power Generation (OPG), a provincially owned electricity generation company whose hydroelectric, nuclear, and fossil fuel stations generate approximately 70% of Ontario’s electricity (the remainder is privately owned). It is also the sole operator of coal-fired plants.
As a 2012 paper by University of Toronto authors explains, the shift away from coal was in part initiated late last century, when the province’s electricity sector went through liberalization and moved to an open market system under the Progressive Conservative government led by then-premier Michael Harris.
In “The Coal Industry and Electricity Policy,” Jodi Lea Adams, Douglas MacDonald, and David Houle explain that “Before Ontario Hydro was dismantled [1998] though, environmental regulations for stationary combustion turbines and regulations on nitrogen oxide and sulfur dioxide emission had already come into place, the former applying to all new generators installed after November 1994 and the later [sic] applying to corporate sources of emissions in manufacturing and energy, including Ontario Hydro from 1994 onward…. Thus a regulatory framework that was discouraging conventional thermal coal was already taking shape as the decade came to a close.”
The authors also note that government’s ownership of coal plants, the absence of long-term power purchase agreements, the age of existing coal plants, and the lack of coal mining in the province all eased opposition to the phaseout.
However, getting from 25% to 0% didn’t happen as quickly as originally planned. Nanticoke Generating Station, for example, was repeatedly scheduled for closure by Ontario Power Generation. Though originally slated for retirement in 2009, that plan was dropped in 2006 when OPG was unable to develop replacement power sources.
Major legislative developments spanned nearly a decade:
- 2001: Regulation requiring phaseout of coal burning at the Lakeview Generating Station by April 2005.
- 2003: Plan to phase out all coal plants by 2007.
- 2005: Phaseout target pushed to 2009 over reliability concerns.
- 2006: Target 2009 phaseout abandoned.
- 2007: Government issues legally binding regulation requiring complete phaseout of coal burning by Dec. 31, 2014.
- 2009: Green Energy Act passed: major emphasis on renewable generation, energy conservation, clean energy job creation, demand-side management, access to transmission and distribution for renewables, and development of a feed-in-tariff (FIT) program.
An Effective (but Expensive) FIT. It’s one thing to declare that you want more renewable power. It’s quite another to make those resources materialize. An important element in renewables development for Ontario has been its feed-in tariff program, introduced as part of the 2009 Green Energy Act. Ontario’s FIT, administered by the OPA, is recognized as the first and most comprehensive in North America. In fact, Ontario’s FIT was one of the most generous worldwide, offering up to 80.2¢ per kWh.
The FIT program’s two-year review, conducted in October 2011, concluded that “the FIT Program has been key to making Ontario a leader in clean energy production and manufacturing. The more than 2,500 small and large FIT projects approved to date will produce enough electricity to power 1.2 million homes. FIT has also attracted more than $27 billion in private sector investment, welcomed more than 30 clean energy companies to the province, created more than 20,000 jobs and is on track to create 50,000 jobs.”
Among the recommendations were that, to reflect lower costs, FIT prices for solar should be reduced more than 20%, on average, and by approximately 15% for wind. Prices for other sources are to remain the same. The review report shows the following original and new FIT prices, in cents/kWh:
- Solar rooftop (price varies by project size, with higher rates for smaller projects): 53.9 to 80.2, lowered to 48.7 to 54.9.
- Solar groundmount (price varies by project size): 44.3 to 64.2, lowered to 34.7 to 44.5.
- Wind (all sizes): 13.5, lowered to 11.5.
However, as with many accelerated renewables plans worldwide, Ontario’s hasn’t always run smoothly. A December 2012 story in the Toronto Globe and Mail reported that “in Ontario’s rush to develop renewable energy, a significant obstacle emerged for many small power producers, particularly in Southwestern Ontario: There wasn’t enough capacity on the aging grid to accommodate all of their built projects.” Stranded solar and wind projects—many of them small, privately owned ones—have been the result. The OPA has offered owners of such projects various options that include relocating the solar panels, combining with other projects to create larger ones, and entering into an agreement for someone else to take over the project.
Other FIT-related growing pains have included the government’s inability to keep up with renewable project applications, localized opposition to wind farms, some short-lived solar-parts manufacturers, questions about oversight of renewables contracts, and, most recently, a December 2012 World Trade Organization ruling (under appeal as of this writing), in a dispute brought initially by Japan, that Ontario was giving preferential treatment and subsidies to renewable generation equipment originating in the province. The government’s FIT-linked obligations have also been partially blamed for Ontario’s budget deficit (close to $12 billion for the fiscal year that began April 2012, according to Finance Minister Dwight Duncan in late January).
As with most other FIT programs, the bottom line seems to be that they do spur development (which is their primary goal), but they always have unanticipated consequences.
Conservation and Smart Grid Efforts. Conservation is the cheapest energy resource, and Ontario has shifted from having no conservation plan in 2003 to generating over 1,700 MW of peak demand savings over the past five years, according to the Ministry of Energy. Conservation measures include updated building codes, building energy audits and retrofits, and demand-side management (DSM) programs enabled by the roll-out of smart meters and time-of-use (TOU) pricing. Earlier this year, the OPA released results showing that in 2011, OPA and local distribution company programs resulted in 645 MW of demand reduction and 717 GWh of energy savings.
It should be noted that, because electricity prices in Ontario are relatively low, there is less built-in incentive to reduce consumption than there might be in a locale like Hawaii or Germany, where retail prices are comparatively higher.
Ontario is a North American smart grid leader and has installed smart meters in a majority of homes and small businesses, which has enabled it to introduce automatic TOU rates that encourage peak load-shifting. (Residential and small business customers also have the option of fixed rate contracts by purchasing electricity from licensed energy retailers.) Both large and small customers can participate in DSM programs; large customers can participate in both voluntary and contractual demand response programs.
The goal is to reduce peak demand 6,300 MW by 2025 and 7,100 MW by 2030, and the province says it is on target to hit those numbers. It also claims that “Over the next 20 years, Ontario’s conservation targets and initiatives are projected to save about $27 billion in ratepayer costs on the basis of a $12 billion investment.” When asked about the amount of last year’s peak load reduction made possible by smart meters and TOU rates, the OEB responded that those numbers were not yet available.
Fuel-Switching. A primary concern of any grid operator is the availability of dispatchable generation, so it’s no surprise that rather than simply shutter all coal plants within a decade, Ontario has explored fuel-switching.
In October 2012, work began on converting the Atikokan Generating Station from a coal-burning plant to a 200-MW one equipped to burn 100% biomass—the first in North America. That project is scheduled for completion in 2014.
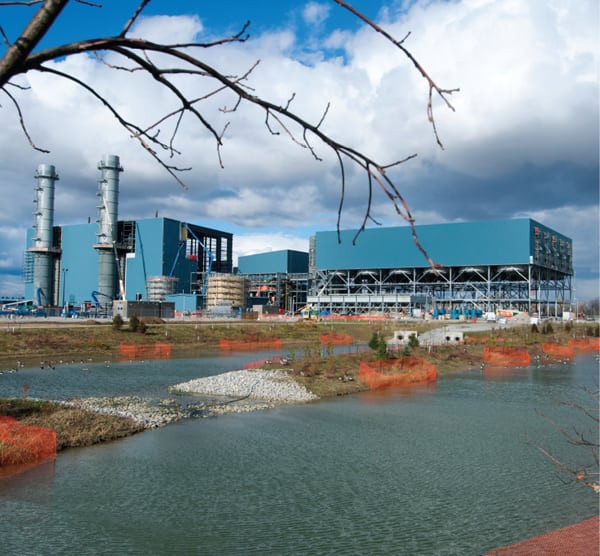
The province’s Long-Term Energy Plan calls for converting two units at the Thunder Bay Generating Station to natural gas to ensure system reliability in northwestern Ontario, “particularly during periods of low hydroelectricity generation and until the proposed enhancement to the East-West tie enters operation.” The plan also considers conversion of some units at Nanticoke and Lambton to natural gas, “if necessary for system reliability.” As of this writing, no decision had been made to begin these conversions.
Swift Solar Development. Despite the red tape and interconnection difficulties encountered by several privately owned micro-generation projects, Ontario has managed to substantially increase the amount of new non-hydro renewables.
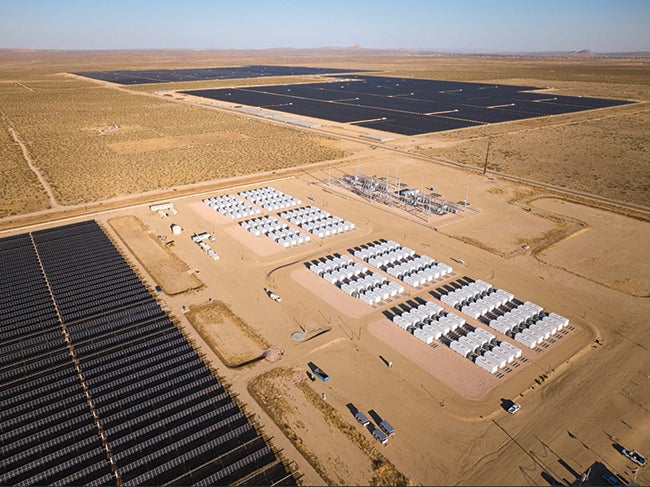
Among the solar power projects developed since the decision to phase out coal is the 80-MW Sarnia Photovoltaic Plant, which was the world’s largest when it went online in 2010. (This plant was a POWER Top Plant Award winner in the renewables category in 2011. See “Sarnia Solar Project” in our December 2011 issue.) An October 2012 government statement noted that the province is home to the 25 largest solar projects in the country and has more than 550 MW of solar photovoltaic (PV) capacity online and more than 1,800 MW of additional solar PV capacity under contract.
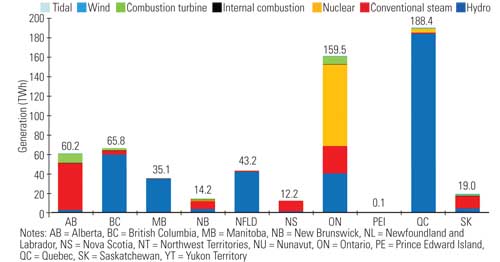
Even with these new developments, solar (in the “Other” category) is practically invisible in the chart of energy output by fuel source in 2012 (Figure 1).
 |
| 1. Energy output by fuel type, 2012. For the first time in the province’s history, wind generation exceeded coal generation in 2012. Source: IESO |
Increasing Wind Generation. According to the Ministry of Energy, Ontario’s grid-connected wind capacity was 15 MW in 2003. At the end of 2012 it was over 1,500 MW. Some stories earlier this year trumpeted the role of wind power in making the coal phaseout achievable, noting that in 2012, wind generated more power (3%) than coal (2.8%). Given that the province had 25% coal generation in 2002, when the IESO market opened, and that wind at the end of 2012 supplied 3% of Ontario’s generation (roughly the same as wind power’s contribution in the U.S. overall), such claims seem overstated.
As in other places, wind power has its vocal opponents in Ontario, some of whom did more than voice opposition to a turbine under construction at the 124-MW Summerhaven project in mid-January, when they painted graffiti on a disassembled tower and blades, and damaged a turbine that was set on fire, according to news reports citing a release by the Ontario Provincial Police. Earlier protests had occurred because an as-yet-unoccupied eagle nest had been removed to enable building of an access road.
Holding Hydro Steady. Hydroelectric generation supplies roughly 26% of Ontario’s power. (Neighboring provinces Manitoba and Quebec are almost totally hydropowered.) Hydro capacity increases have been marginal, growing from a total of 8,100 MW in 2005 to 8,400 MW in 2012 and 8,900 MW (projected) by 2015, according to the OPA.
Powering Up Nuclear. Nuclear power supplies more than 50% of Ontario’s electricity. OPG owns and operates the Pickering and Darlington Nuclear Power Stations, which have a combined generating capacity of about 6,600 MW. (See the story on p. 54 in this issue about plans for new units at Darlington.) OPA also owns the Bruce Nuclear Generating Station, which Bruce Power operates under a lease agreement. The Bruce station, the largest nuclear facility in the world, has eight operating units totaling 6,300 MW and supplies roughly a quarter of the province’s power.
OPA data show nuclear supplying 79 TWh in 2005, 85 TWh in 2012, and 93 TWh (projected) in 2015. Interestingly, the Long-Term Energy Plan projects nuclear power, which supplied 56% of all generation in 2012, supplying only 46% of total generation by 2030.
Filling the Narrowing Gaps with Gas. Ontario has limited natural gas reserves, so it imports most of the fuel from Saskatchewan, Alberta, and British Columbia. Despite the availability of Canadian gas, and in contrast to projections of increasing gas-fired generation south of the border, OPA actually projects that gas-fired generation will drop in the next few years. Though gas-fired generation supplied 12 TWh in 2005 and 22 TWh in 2012, it is expected to supply only 9 TWh in 2015. The drop in gas generation is expected to be offset by increases in nuclear, hydro, and the nonhydro renewables mentioned above.
Early Results from a Coal-Free Grid
Although the province isn’t 100% coal-free yet, it’s close enough to make some preliminary assessments of the results. The government’s January 2013 announcement noted that, according to a 2005 independent study, “Cost Benefit Analysis: Replacing Ontario’s Coal-Fired Electricity Generation,” phasing out coal-fired generation is expected to save the province “approximately $4.4 billion annually when health and environmental costs are taken into consideration.” Though such assessments may be open to debate, it is possible to evaluate other early results more squarely.
On the Grid and Fuel Mix. In September 2012, the IESO said the supply outlook was good at least through 2014: “Over the next 18 months, more than 3,000 megawatts (MW) of capacity will be added to the grid, comprising approximately 1,500 MW of nuclear generation and 1,500 MW of grid-connected renewable generation. By February 2014, total wind and solar generation connected to the transmission and distribution systems in Ontario will reach approximately 4,800 MW.” Over the longer term, a combination of renewables and conservation is expected to meet additional demand (Table 2).
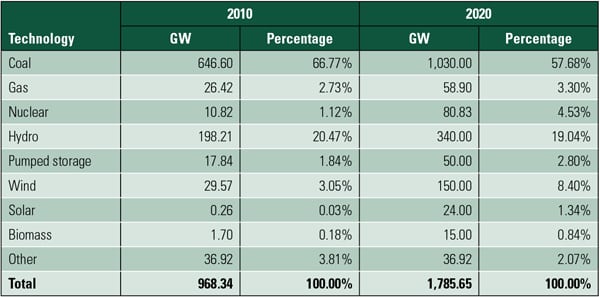
 |
| Table 2. Historic and projected capacity, by fuel. Projections were made in the 2010 “Ontario’s Long-Term Energy Plan.” Sources: Ministry of Energy (projections), IESO (2012) |
To date, the grid has suffered no ill effects and, in fact, has a healthy reserve margin and has been a net power exporter.
In November 2012, the IESO projected a yearly reserve margin of 20.2% for 2013 and reserve margins at or above 18% through 2017—easily meeting the resource adequacy criterion for the next five years “assuming all new resources and transmission development projects are delivered on time.” Ontario’s required reserve margin averages approximately 18.7% without reliance on emergency operating procedures or imports. Note that in the modeling for Ontario’s most recent projection, 13% of installed wind capacity was assumed to be available at the time of summer peak, and 33% at the winter peak.
The IESO says that the province has the capacity to import or export “approximately 4,800 MW at any one time, depending on system conditions.” Its high-voltage transmission grid is connected to Manitoba, Quebec, New York, Michigan, and Minnesota. Net imports or exports have varied from year to year since 1997, when net imports were –2.6 TWh, followed by 3 TWh in 1998. In 2003, net imports were 4.1 TWh, followed by 0.3 TWh in 2004. Ontario has been posting higher net exports ever since, with a high of 10.9 TWh exported in 2008 and 9.9 TWh most recently, in 2012.
As for managing increased variable resources on the grid, that hasn’t posed insurmountable problems. In a January Toronto Star piece, Tyler Hamilton, energy and technology columnist, quoted Bruce Campbell, vice-president of resource integration at the IESO, as saying that the province hasn’t yet had to increase back-up reserves because of the amount of wind power on the grid. Hamilton notes, “If we were to stick with our coal phase-out strategy without wind, we would need to burn more natural gas. The reality is that when the wind blows it gives us the opportunity to burn less natural gas when it’s being used to displace coal. This is partially why greenhouse-gas emissions associated with electricity generation in Ontario have fallen by two-thirds since 2003.”
On Retail Prices. Just as in the U.S., there has been considerable debate about how cutting coal and adding variable renewable capacity will affect retail electric rates. Even the provincial government has acknowledged that rates will increase, saying, “Over the past 20 years, the price of water, fuel oil and cable TV have outpaced the price of electricity. Over the next 20 years, Ontario can expect stable prices that also reflect the true cost of electricity.” About 40% of the province’s generation is subject to price regulation, “contributing significantly to predictable prices for Ontario consumers,” the government says.
As of January 2013, with less than 3% coal-fired capacity, the IESO had posted the following rates: Under the regulated rate plan, consumption of up to and including 1,000 kWh/month: 7.4¢/kWh; more than 1,000 kWh/month: 8.7¢/kWh. TOU rates varied from 6.3¢/kWh to 11.8¢. Residential customers with smart meters (the majority) have three different TOU rates: 6.3¢/kWh for off-peak, 9.9¢/kWh for mid-peak, and 11.8¢/kWh for on-peak. TOU prices are reviewed every May 1 and November 1 by the OEB.
It’s always difficult to compare rates and plans across different regulatory regimes and nations, but given the virtual parity of the U.S. and Canadian dollars in early 2013, it’s worth comparing Ontario’s rates with those in Illinois.
Illinois has a similar population (12,875,255 for 2012), its major population centers share a similar climate, and it also has substantial nuclear generation. The state, which in 2010 ranked third in recoverable coal reserves at producing mines in the U.S., generated 6,208 GWh from coal, second only to nuclear (7,557 GWh) for power generation as of September 2012 U.S. Energy Information Administration data. The state’s average retail rate year-to-date October 2012 was 11.45¢/kWh residential (8.58¢ for all sectors). That average is higher than all Ontario residential rates except for on-peak TOU pricing. Simply having more coal than variable renewables on your grid doesn’t guarantee lower rates.
The Ontario government anticipates that prices for residential and small business customers will increase about 3.5% annually through 2030. The biggest jump, according to the 2010 Long-Term Energy Plan, will be over the five years following the plan, when “residential electricity prices are expected to rise by about 7.9 per cent annually (or 46 per cent over five years). This increase will help pay for critical improvements to the electricity capacity in nuclear and gas, transmission and distribution (accounting for about 44 per cent of the price increase) and investment in new, clean renewable energy generation (56 per cent of the increase).” A program for eligible low-income consumers provides a benefit equal to 10% of the total cost of electricity.
The rate for industrial users is expected to increase about 2.7% annually through 2030. The province says it is working to mitigate the effects of the increase through efficiency programs.
It may surprise some south of the Canadian border that prices aren’t the only concern for the public. As a blog post by Ontario environmental lawyer Dianne Saxe on June 7, 2010, noted: “Hamilton City Council passed a motion on May 12, 2010, requesting Ontario’s Government to order OPG to put its coal plants on standby and only operate them as a last resort…. Kitchener and Guelph have recently passed similar resolutions…. Such resolutions have no legal force, but who would ever have thought that we’d see municipalities calling for cleaner, more expensive power?”
On GHGs and Other Emissions. Though the province’s greenhouse gas emissions have dropped two-thirds since 2003, then-premier Dalton McGuinty acknowledged in January that Ontario’s coal phaseout wouldn’t stop coal plant development elsewhere in the world. However, local emissions of GHGs will drop, along with other byproducts of coal combustion, thereby improving local air quality and health for Ontarians.
The government’s January announcement said that “The closure of coal plants has already produced significant health and environmental benefits for Ontarians. For example, 2011 sulfur dioxide and nitrogen oxides emissions were 93 per cent and 85 per cent lower, respectively, than they were in 2003. And in 2011, Ontario’s coal plants emitted 43 kilograms of mercury, the lowest on record in over 45 years.”
Model Program or Isolated Case?
So what does Ontario’s coal phaseout mean for the rest of Canada, other developed nations, and the developing world? The availability and price of fuels—whether they be fossil-derived or renewable ones—will continue to play a powerful role in the short term. But global power industry incumbents may be setting themselves up for unwelcome surprise if they fail to realize the power of example.
Whether you think Ontario’s energy policy is a good one or not may depend on where you stand on energy policies generally and what role you play in the global energy industry. If you are a vendor to just the North American coal-fired generation sector, you won’t like the fact that Ontario has proven a large geographic area with a substantial population can—at least under supportive policy—go coal-free. If you serve a global client base, you’ll see developing nations, which plan to build considerable coal capacity, as more promising markets. On the other hand, if you are looking for examples of decreasing a carbon footprint by way of generation portfolio adjustments and grid upgrades, you’ll see Ontario’s experience as a model.
Regardless of one’s policy stance, Ontario’s experience demonstrates that even under the most supportive political and economic conditions, accelerated renewables and smart grid programs will encounter unexpected hurdles. To expect zero difficulties would be unrealistic.
It’s also unrealistic to think that others won’t attempt to follow Ontario’s example. A January article in Mother Jones had former Minister of Energy Chris Bentley commenting that, even though the U.S. has its unique challenges in dealing with coal, “he learned one thing from his experience cutting it out that can apply to his US counterparts: ‘There are far more people who are supportive than the critics would like you to believe.’”
The debate about whether or not Ontario’s grand plan to eliminate coal power was worthwhile—in terms of GHG emissions, health effects, grid stability, economic impact, and consumer prices—is bound to continue long past 2014. Though the effects on grid reliability and retail prices to date have been benign, only time will tell if the long-term consequences are any harder to bear than those felt by provinces, states, and nations that defer the development of cleaner generation and modern grids even longer.
One thing that can’t be debated is that when the last Ontario coal-fired plant stops sending power to the grid, naysayers won’t be able to say it can’t be done.
— Gail Reitenbach, PhD is POWER’s managing editor.