Large-scale battery power capacity in the U.S. surged 35% over 2020 to reach 1,650 MW, and according to the Energy Information Administration (EIA), utilities are planning to ramp up that capacity by 10 GW over the next two years.
In a newly released report, Battery Storage in the United States: An Update on Market Trends, the EIA reported, citing an annual report, that at the end of 2019, 163 large-scale battery energy storage systems (BESS)—grid-connected systems of more than 1 MW—were operating in the U.S., representing a maximum energy capacity of 1,688 MWh and a maximum power capacity of 1,022 MW. The EIA’s most recent monthly electric generator inventory for May 2021, however, suggests 244 BESS (mostly large-scale systems) are currently operating, representing a total maximum power capacity of 2.4 GW. According to that data, another 13 GW is in planning through 2024. About 10 GW will be added between 2021 and 2023, the agency said.
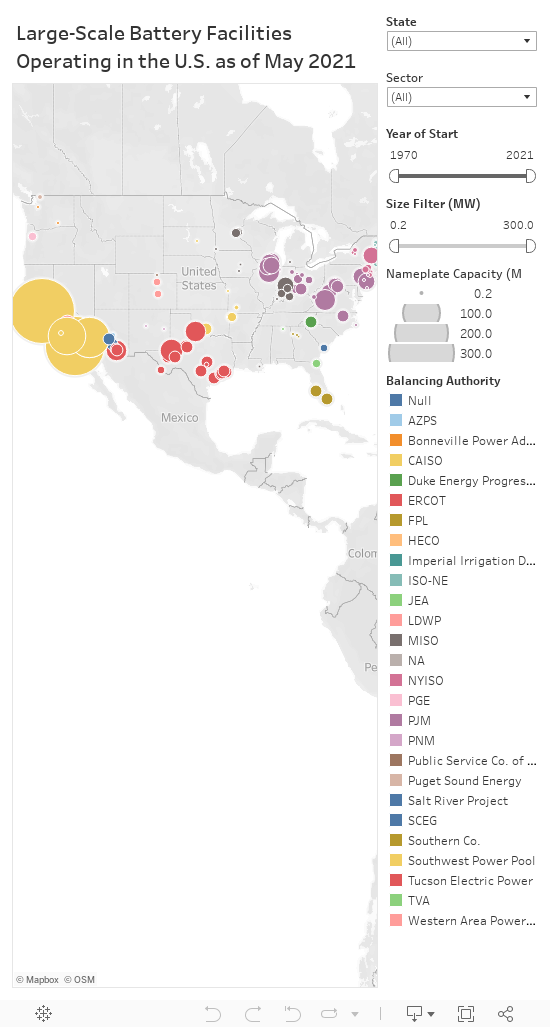
Large-Scale Battery Facilities Operating in the U.S. as of May 2021 Source: POWER/Preliminary Monthly Electric Generator Inventory (based on Form EIA-860M as a supplement to Form EIA-860)
Surprising Trends
As of December 2020, five states accounted for more than 70% of U.S. battery storage power capacity, with California alone accounting for 31% of the U.S. total (506 MW). Texas, Illinois, Massachusetts, and Hawaii each have more than 50 MW of power capacity.
The bulk of battery storage power capacity operating today has mostly been installed by independent power producers (IPPs) in competitive markets. “About 74% of large-scale battery storage power capacity and 72% of energy capacity in the United States is installed in areas covered by independent system operators (ISOs) or regional transmission organizations (RTOs),” the EIA report says, noting that ISOs and RTOs account for only 58% of total grid capacity in the U.S. “The disproportionate share of battery storage across ISOs and RTOs may result from differences in market design and policies compared to the utilities that integrate generation and distribution themselves which prevail elsewhere,” it says.
At the end of 2019, PJM Interconnection hosted about 30% of the existing large-scale power capacity, most of which was built between 2014 and 2016. “This period of growth in large-scale battery storage power capacity in PJM most likely resulted from changes in PJM’s market for frequency regulation (a grid service that helps balance momentary differences between electricity demand and supply within the transmission grid) in 2012, which created a specific requirement for fast-response resources, such as batteries. In 2015, PJM capped the market share for fast-responding resources as a result of grid reliability concerns, and PJM has had relatively less storage growth since these changes occurred.”
The California Independent System Operator (CAISO), meanwhile, hosted about 20% of existing large-scale BESS power capacity in the U.S. in 2019, but these installations accounted for 36% of existing energy capacity. Power capacity, typically represented in MW, measures the maximum amount of power a battery system can discharge in an instant, while energy capacity, represented in MWh, measures the amount of energy a battery system can store, the EIA explained.
“California uses battery storage for reliability purposes, so large-scale battery storage installations tend to be energy-oriented with small power capacities and long durations,” it said. In 2019, operating large-scale battery storage systems in CAISO had an average power capacity of 4.7 MW, an average energy capacity of 14.4 MWh, and an average duration of 4.0 hours. In contrast, existing installations in PJM tend to be power-oriented with larger capacities but shorter durations to serve frequency regulation applications, the report suggests. In 2019, large-scale battery storage installations in PJM had an average power capacity of 10.8 MW, an average energy capacity of 6.8 MWh, and an average duration of 45 minutes.
The battery chemistry installed in most markets, however, is similar. More than 90% of large-scale BESS facilities operating across the U.S. largely use lithium-ion technology. Sodium-based battery storage was used in 2% of the installed large-scale power capacity and 4% of the installed large-scale energy capacity in the U.S. at the end of 2019, while flow batteries were used in 1% of the installed power and energy capacity.
Average Battery Usage Factor in 2019 Was 6%
According to the report, normalized energy capacity costs (in dollars per kilowatt-hour) have decreased over time—falling by 72% between 2015 and 2019 for an average five-year annual decrease of 27%—though power capacity costs have remained relatively stable. “The trends of declining costs in terms of energy capacity and of relatively stable costs in terms of power capacity result from the increasing durations and larger energy capacities over time,” the EIA explained. However, major challenges exist in determining the profitability and cost of battery storage systems, the agency said. “Unlike other energy sources, battery storage can supply and consume energy at different times of the day, creating a combination of cost and revenue streams that makes it challenging to directly compare storage with generation-only technologies. Batteries are not standalone generation sources and must procure electricity supplied by generators to recharge and cover the round-trip efficiency losses they have during cycles of charging and discharging,” it said.
Overall, however, the EIA said that batteries tend to be a “net consumer” of electricity. “Of the 150 plants (1,022 MW) that reported operating battery storage capacity on Form EIA-860 in 2019, 109 plants (850 MW) also reported electricity generation and consumption data on Form EIA-923 in 2019. These 109 plants reported a total of 458,169 MWh of gross discharge and 553,705 MWh of gross charge in 2019 (an average round-trip efficiency of 85%),” the report notes. “About half of the reported gross discharge was PJM serving its frequency regulation market.”
Another notable finding: Battery usage factors—which the EIA calculates solely using gross discharge (and which the EIA cautions cannot be directly compared to usage factors for generation because batteries can provide value to the grid both when charging and discharging)—from the 109 plants that reported generation and consumption was on average 6% in 2019. However, usage factors varied by region: In PJM and CAISO, they were above average at nearly 9%, while systems in ERCOT were well below the average at 3%. Systems in Hawaii, Alaska, and in regions not included in the CAISO footprint had an average usage factor of under 1%.
Looking ahead, the EIA expects battery installations to pick up, owing largely to market and policy drivers. In wholesale markets, ISOs and RTOs have “begun to carve a path of storage to participate in individual markets,” directed by recently promulgated orders from the Federal Energy Regulatory Commission (FERC), including Order No. 841 and No. 2222. New installments are also being encouraged by the investment tax credit and state-level policy actions. As of June 2021, eight states have set energy storage requirements or targets.
Looking Ahead: 10 GW Over Two Years
The EIA expects that California will lead future installations. California utilities account for 40% of battery storage power capacity planned for installation between 2021 and 2023, it noted. “These planned additions put California in line to meet its energy storage requirement (Assembly Bill 2514), which is that [investor-owned utilities] install 1,325 MW of energy storage by 2024. New York and Massachusetts also have state requirements for energy storage and companies have planned battery storage projects in the upcoming years. Virginia and New Jersey have requirements, but no companies have reported any planned energy storage builds to us,” EIA said.
States without policy requirements like Texas, Arizona, Nevada, New Mexico, Florida, Hawaii, Colorado, and Montana are also showing strong growth. “Strong forecasted growth in the Southwest highlights an increase in battery storage in states outside of RTO and ISO regions as well. Lower battery costs, in addition to lessons learned from previous storage deployment in regions with market rules or state requirements, may have led to increased investment of battery storage in the regions new to battery storage,” it suggested.
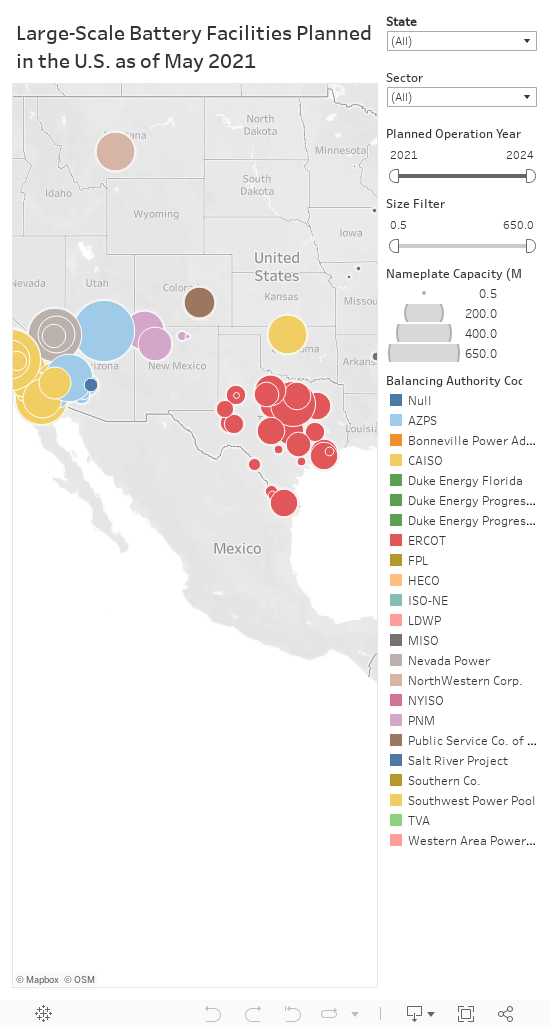
Large-Scale Battery Facilities Planned in the U.S. as of May 2021. Source: POWER/Preliminary Monthly Electric Generator Inventory (based on Form EIA-860M as a supplement to Form EIA-860)
Another trend the EIA highlighted is that battery storage projects are increasingly being paired with power-generating technologies, especially wind and solar. “Between 2011 and 2020, 92 power plants with co-located battery storage systems came online with a combined power capacity of 628 MW. Data reported for proposed projects show an additional 7,689 MW (100 plants) with co-located battery storage systems are planned to come online between 2021 and 2023, compared with 3,115 MW of standalone storage (59 plants),” it said.
As of December 2020, about 50% of operating co-located battery storage power capacity was paired with wind turbines, and the rest was split between solar and fossil fuel generation. But that trend is set to shift significantly: “80% of co-located battery storage power capacity that is planned to come online between 2021 and 2023 will be paired with solar,” the EIA said.
—Sonal Patel is a POWER senior associate editor (@sonalcpatel, @POWERmagazine).