The world’s frenzied economic growth through 2040 won’t be matched by electricity demand growth, the Energy Information Administration (EIA) says in the International Energy Outlook 2016 (IEO2016 ) released on May 11.
World net electricity generation will jump 69% by 2040, the IEO2016 reference case projects, but that is still well below “what it would be if economic growth and electricity demand growth maintained the same relationship they had in the recent past,” the agency’s biannual forecast says.
According to the EIA, from 2005 to 2012, world gross domestic product (GDP) increased by 3.7% per year while world net electricity generation rose by 3.2% per year. The IEO2016 reference case suggests that between 2012 and 2040, while world GDP will sprout by 3.3% per year, but world net electricity generation will grow only about 1.9% per year.
The lowered demand growth projections hinge on actions that many countries may take to improve efficiency. Most members of the Organisation for Economic Co‑operation and Development (OECD) are also pursuing policies and rules that could force generators to curb their carbon dioxide emissions.
The IEO2016 reflects newly introduced clean energy policies, including China’s target to get 15% of its electricity from renewables by 2020, the European Union’s 2030 Energy Framework objectives, and India’s ambitious wind and solar initiatives. It does not, however, include the effect of the August 2015–finalized Clean Power Plan (though effects of the proposed rule are considered).
A Shadow on Coal Generation, a Spotlight on Natural Gas, Renewables, Nuclear
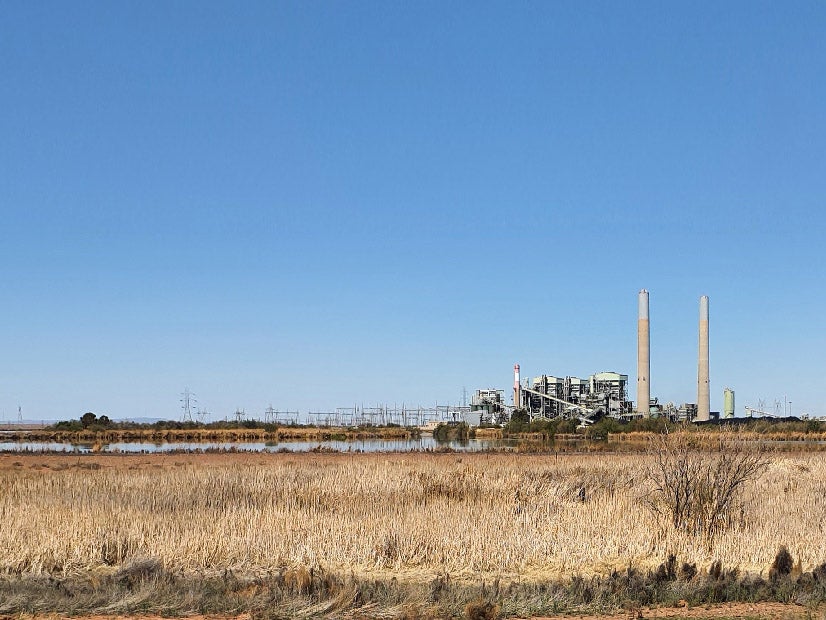
Among its notable findings [SLIDESHOW] is that coal’s share of world generation, which has typically hovered between 37% and 40% since the 1980s, will drop from 40% in 2012 to 29% in 2040—even as world coal-fired generation increases by 25% through 2040. These echo findings by the International Energy Agency in its November 2015–released World Energy Outlook (WEO-2015), which projects that coal’s share will drop from 41% in 2013 to 30% in 2040.
And despite current low oil prices, the use of petroleum and other liquid fuels for power generation is also expected to fall. The EIA projected that oil prices will be higher in the long term, and generation from liquid fuels will fall from 5% in 2012 to 2% in 2040.
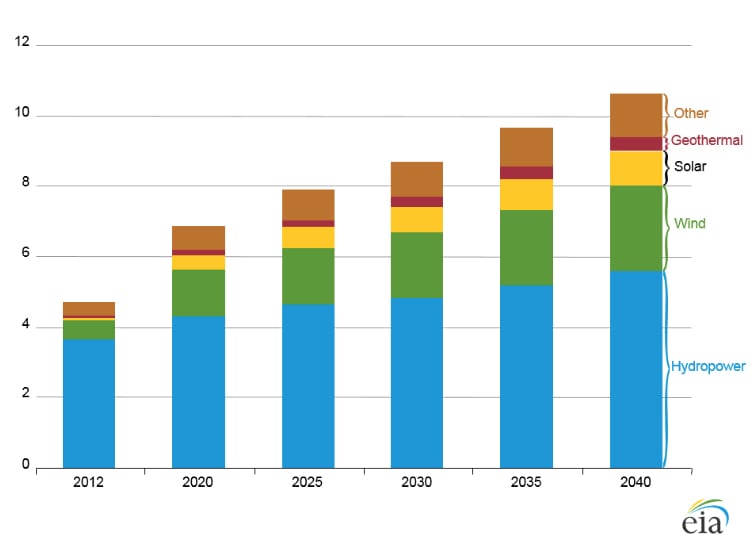
Comparatively, the IEO2016 foresees a tremendous expansion for both the shares of renewables and natural gas generation. Renewables’ share is expected to grow from 22% in 2012 to 29% in 2040—mostly from hydropower, but also substantially from nonhydropower renewables. The share of nonhydropower renewables is projected to shoot up from 5% in 2012 to 14% in 2040 in the IEO2016 reference case. In developing countries, solar’s forecast growth—at an average 15.7% per year over the period—is expected to overshadow wind’s 7.7% and geothermal’s 8.6% per year growth. In the OECD region, wind, solar, and geothermal generation is predicted to grow at comparable rates of about 4.5% per year.
The natural gas share of world generation is also foreseen surging from 22% in 2012 to 28% in 2040. However, the EIA noted, “if other nations with shale gas resources (notably, China) are able to replicate the U.S. success in exploiting shale gas production, the outlook for world natural gas-fired electricity generation could be much different from that represented in the IEO2016 Reference case.”
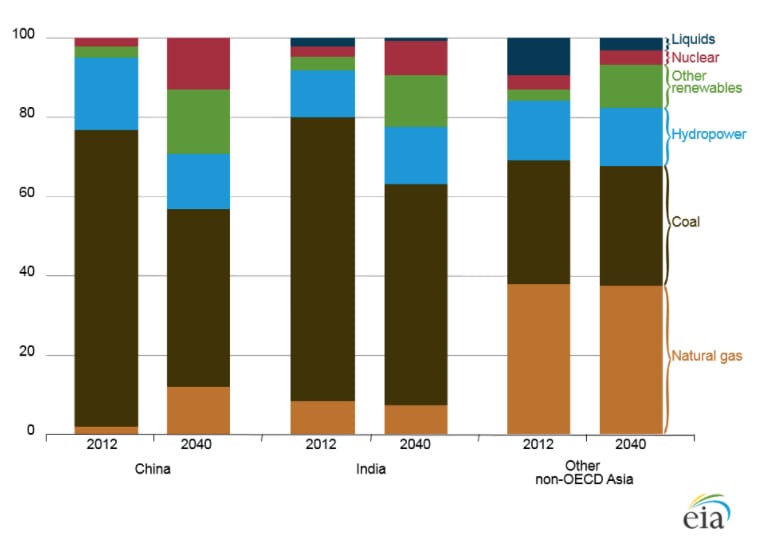
Meanwhile, average annual growth rates for nuclear electricity generation from 2012 to 2040 in the reference case include 9.6% in China, 7.9% in India, and 2.9% in the other non-OECD Asia economies. China has the largest projected increase in nuclear capacity, adding 139 GW from 2012 to 2040, followed by 36 GW in India and 8 GW in the remaining non-OECD Asian countries. In the Middle East, nuclear capacity is expected to increase from less than 1 GW in 2012 to 22 GW in 2030.
A Variable World
The EIA notes that comparisons between countries can be cumbersome because patterns of generator use—measured by annual capacity factors, or the ratio of generation to capacity—vary significantly. An interesting analysis it conducted of generating plant utilization from 2008 through 2012, for example, shows wide variability among fuel types and among world regions.
Variability is caused by a wide range of factors, including differences in daily load patterns, operating costs (driven mainly by fuel costs), planned outages to meet regulatory and maintenance requirements, and differences in the efficiencies of generating technologies. Annual capacity factors also can be affected by partial-year generation effects if the unit was installed within the past year.
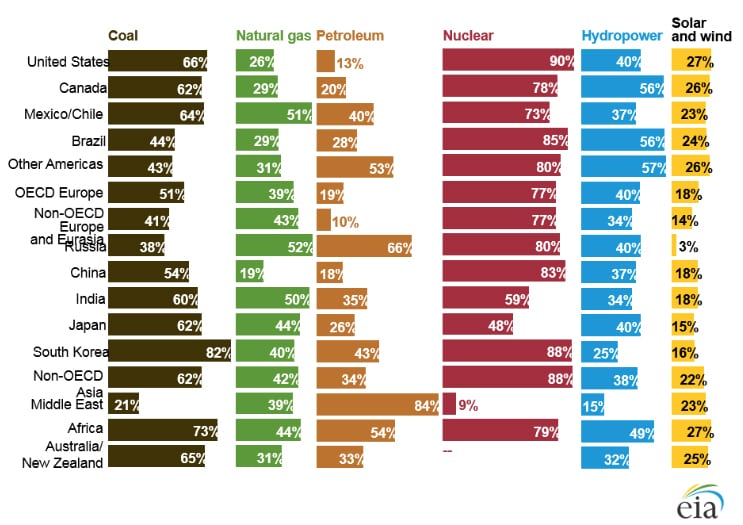
In the U.S., for example, the five-year average solar capacity factor is 15%. In comparison, solar capacity factors in other countries and regions are considerably lower: Solar generators in Canada have a five-year average capacity factor of 6%; non-OECD Europe and Eurasia 5%; and the Middle East 8%. And, in many regions of the world, including the U.S., the average capacity factor of wind generating facilities from 2008 through 2012 was about 30%; however, the average capacity factor for wind facilities in China during the same period was 18%, “primarily because of partial-year generation effects caused by rapid capacity expansion,” the EIA said.
Capacity factors for nuclear plants are the least variable. But while the baseline average U.S. annual capacity factor for nuclear generators from 2008 through 2012 was 90%, in other countries and regions, nuclear capacity factors average 73%, as a result of different operating policies and regulatory requirements.
Growing environmental concerns about coal generation, as well as competition from natural gas–fired and renewable generation, has also led to lower capacity factors for coal-fired power plants in some countries. For example, South Korea’s fleet of coal-fired power plants had an average capacity factor of 82% from 2008 through 2012, while the average for natural gas–fired plants and petroleum-fired plants was about 40%. Coal-fired units had significantly higher capacity factors because of significant improvements in efficiency (in 2010, 70% of South Korea’s total coal-fired generation came from highly efficient supercritical units), the EIA said.
In the U.S., by comparison, capacity factors averaged 66% from 2008 through 2012, mostly because during that period, half of the nation’s fleet was at least 40 years old. “In addition, the installation and operation of pollution-control equipment required by a range of regulatory policies on emissions led to rapid increases in operating costs that discouraged the use of coal for power generation, even as average coal prices remained consistently low from 2008 through 2012,” the EIA said.
China reported an average capacity factor of 51% for its coal-fired fleet from 2008 through 2012, which the EIA explained was caused by the use of coal-fired units to satisfy peak demand requirements, a rapid buildup of new coal-fired capacity, and a large increase in hydroelectric generating capacity during that period. OECD Europe’s low 54% capacity factor for coal generators can be explained by a combination of lower electricity demand and growth of renewable capacity, it said.
—Sonal Patel, associate editor (@POWERmagazine, @sonalcpatel)