News on extreme weather events in the U.S. report an increase in both frequency and size over the last couple of years, including thunderstorms, tornadoes, convective storms, flash floods, hurricanes, and winter storms. This has a massive impact on a renewable energy asset’s reliability and insurability; there have even been cases where lenders won’t approve certain projects due to the high risk of natural catastrophe (NatCat) induced damaged.
Severe hailstorms are the biggest risk for PV solar farm projects. Insurer GCube recently reported that 70% of solar losses in the last 10 years occurred after 2017. For onshore wind farms, lightning strikes can be devastating, even though most turbines have built in lightning protection systems (LPSs).
The effects of these recent NatCat trends and reported losses have translated into higher and very dynamic premiums, more conservative underwriting by insurers—all within a somewhat hardening market. Project owners need to pay closer attention to NatCat exposures to ensure project funding and to convince insurers of low risk overall. Further industry investigation on vulnerability of these weather events is needed.
Risks Are High
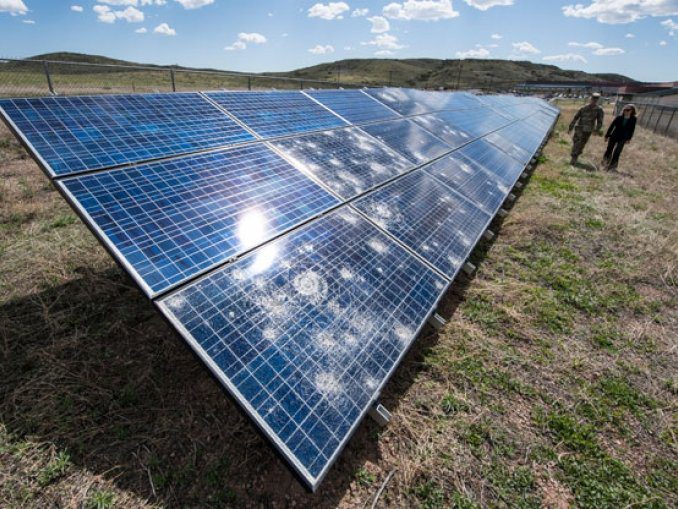
Texas, Colorado, and Nebraska are some of the most exposed states when it comes to hailstorms. The Midway Solar Project in Texas is in a moderate hail risk zone per Swiss Re’s CatNet, corresponding with 0.2 to 0.4 hail days per year. In 2019, the site was hit by a severe hailstorm causing damage to the installed PV modules to a total value of between $70 million and $80 million. Since then, several large-scale losses due to hail have occurred in solar farms located in the state of Texas, which will be the focus in this article.
For onshore wind farms, lightning strikes can be devastating even though most turbines have built in lightning protection. Recent industry numbers show approximately 3,800 turbine blades hit by lightning on average per year globally, out of the roughly 700,000 blades installed. However, the actual risk is highly dependent on the severity of lightning risk, based on a project’s geographical location.
Design and Reliability
Most solar panels are designed per International Electrotechnical Commission (IEC) 61215 standards and Underwriters Laboratories (UL) 61703 standards. The requirements for hail testing are in Table 1.

In This Issue
Full issue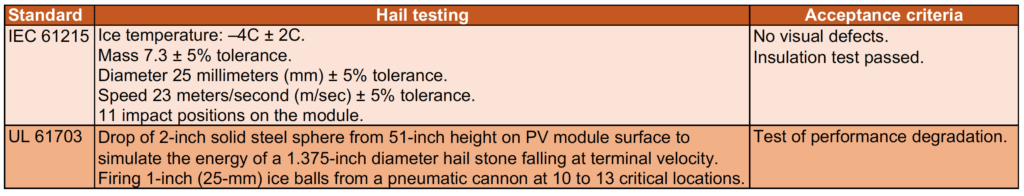
The actual effect of the hailstorm is not just dependent on the size of the hail, but also the speed, density, mass, and impact angle. One of the possible mitigation effects is to use a PV panel tracking system equipped with a hail stow position. This moves the panels to a tilt position with a higher angle against the incoming hail, typically 30 to 60 degrees, thus reducing the impact. Interestingly, the current requirements in Table 1 only cover hail size up to 2 inches. Some manufacturers address this by adding additional testing to their respective panels, such as testing done by PVEL (50-mm hail size, 32 m/s, at 11 locations).
Wind turbines need protection from lightning strikes, particularly the blades, bearings, and electrical systems. Turbine manufacturers typically include an LPS in designs to protect against catastrophic failure following a lightning strike. In recent years, several large losses due to lighting-induced blade failures have caused some of the larger original equipment manufacturers (OEMs) to take on large warranty claims, requiring them to re-design their existing protection systems.
What Does the Weather Data Tell Us?
An analysis of statistics from the National Centers for Environmental Information (NCEI), an office of the National Oceanic and Atmospheric Administration (NOAA), shows the following:
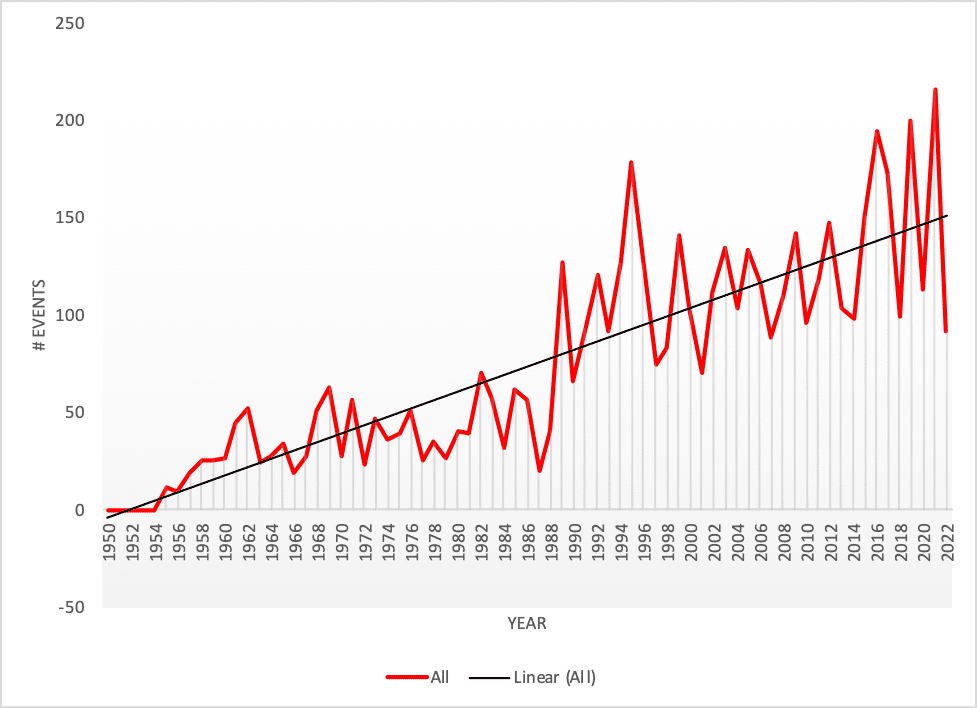
- 26,359 hail events with a hail size of 2 inches or larger have been registered in the U.S. since 1950, with a clear increase in frequency (Figure 1).
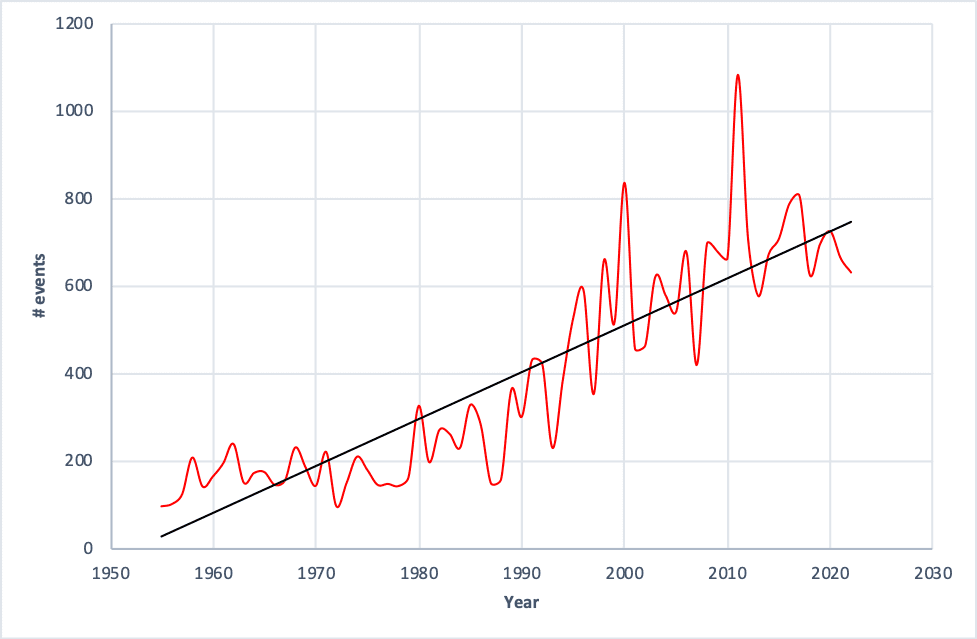
1. Recorded hail events in the U.S. ≥ 2 inch, 1950–2022. Source: National Centers for Environmental Information (NCEI) - A record 1,080 hail events in the U.S. with hail size of 2 inches or larger were recorded in 2011, followed by 834 events recorded in the year 2000. Since the peak in 2011, a somewhat negative trend exists, with some 662 hail events recorded in 2021.
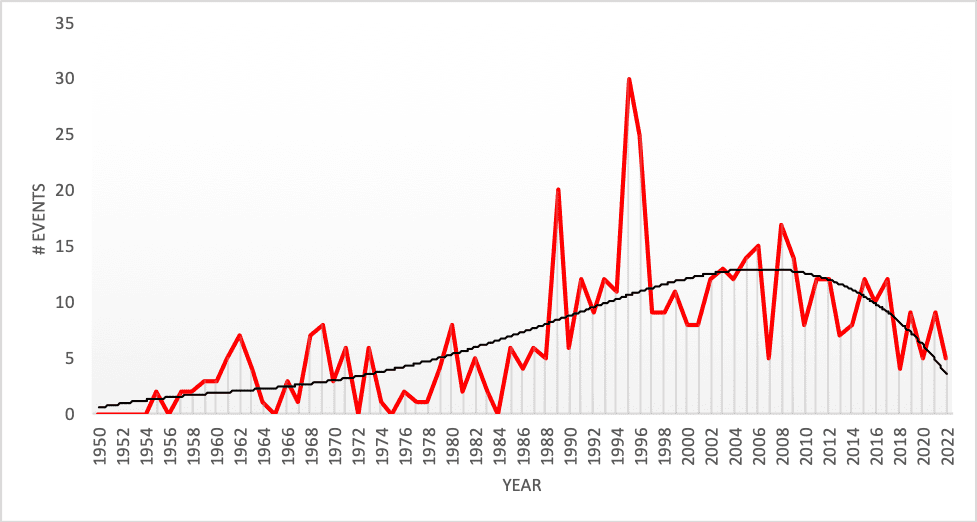
- 5,395 hail events of 2-inch diameter or larger were recorded in Texas from 1950 to 2022, showing a significantly increasing trend (Figure 2).
2. Recorded hail events in Texas ≥ 2 inch, 1950–2022. Source: NCEI - 216 hail events equal to or larger than 2 inches were recorded in Texas in 2021, representing 3% of the total recorded events in the U.S. that year. In comparison, the percentage of hail events in Texas at a size of 2 inches or larger in the year 2000 was only 7.2%.
- Overall, hailstorms in the U.S. with hail size equal to or larger than 2 inches in diameter have significantly increased in frequency over the years, while larger hailstorm events with hail size at between 4 inches and 5 inches have decreased since 2007 (Figure 3).
3. Recorded hail events in Texas 5 inch > X ≥ 4 inch, 1950–2022. Source: NCEI - At the same time, a slightly increasing trend exists for hailstorms sized 5 inches or larger, even though these are extremely rare.
- Reported hail property damage in Texas has significantly increased and shows an increasing trend over time. The five-year average damage is five times higher in 2022 compared to 1993 (Figure 4, without accounting for inflation).
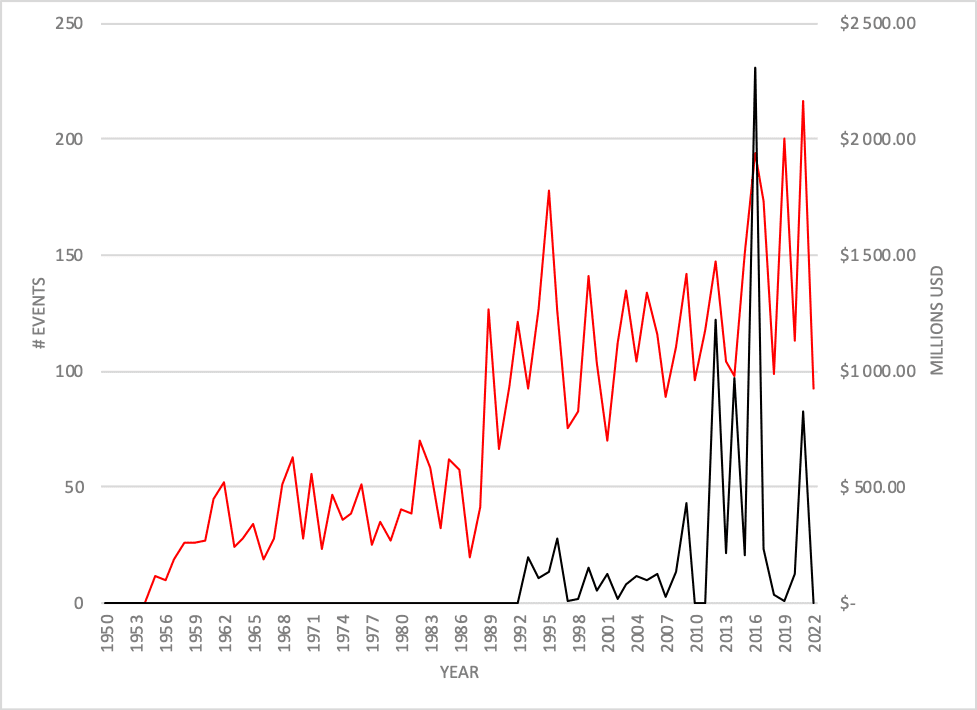
4. 2 inch and above hail trends (left axis, red) in Texas, 1950–2022, and corresponding reported property damage (right axis, black). Source: NCEI - Overall reported hail-induced property damage peaked in 2017 in the U.S.—in line with the increasing number of events—at $2.6 billion, as per the NOAA database, and has had a declining trend since then.
- Analysis of 918 recorded lightning events from 1996 to date in Texas show that the frequency has significantly decreased since 2009. However, the reported property damage is showing an increasing trend (Figure 5). The five-year average damage is 50% higher in 2022 compared to 2000.
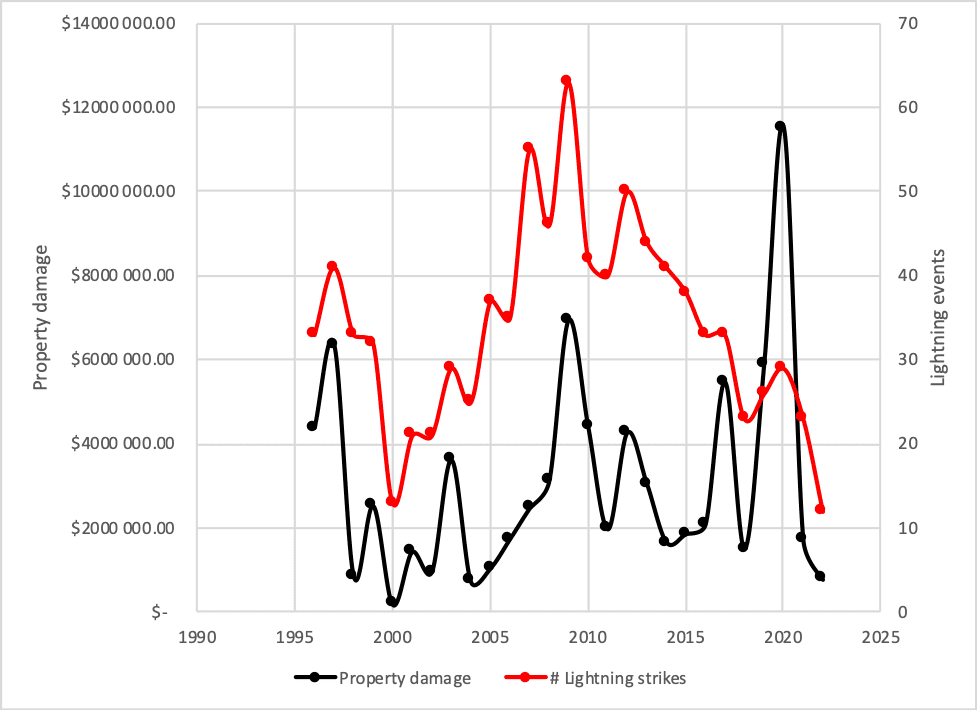
5. Frequency and property damage of lightning storms in Texas, 1990 to 2022. Source: NCEI - This leads to the conclusion that although severe lightning storms in Texas aren’t increasing in frequency, they are getting stronger and causing more damage.
The observations above, which, admittedly, could be subject to observation bias, lead to many questions for projects already in operation and projects under development:
- What will the impact be in 10 to 15 years’ time?
- Did the hailstorm frequency peak in 2011 and is the risk now decreasing or are we currently in a dip that will turn back up again?
- What is the increased risk for wind and solar assets, and how should stakeholders address this?
- Even with smaller size hail events, will a higher frequency of these cause more microcracks and subsequent increase in damage on solar panels? Bear in mind that microcracks are typically excluded from insurance policies, hence, the cost will be on the project company to retain unless covered by product warranty.
What’s the Solution?
The following actions can be taken to reduce the risk over time:
- Perform robust probabilistic modeling for projects in the development stage, including long-term trends of weather. Re-evaluate projects if currently in operation.
- Submit a few PV panels for lab testing every five to 10 years to ensure there are no microcracks present.
- Ensure PV panels are equipped with hail stow protection, and that the operations and maintenance company is fully aware of how and when to deploy it. This includes the use of weather monitoring stations, weather forecasts, a system to notify operators of incoming storms, and a procedure to stow the panels following notification. Minor operational mistakes can lead to significant damage if the system is not deployed properly.
- For projects already in operation without hail stow protection installed, other solutions exist, such as hail netting.
- Install weather monitoring systems some distance outside the plant perimeter (one to five miles) of the solar farm. This allows for earlier detection of hailstorm events, which can be critical given the time it would take to allow for panels to move into position (typically five to eight minutes).
- Explore the use of parametric insurance solutions to cover hail and other NatCat events.
- For wind turbines, investigate how increasing lightning strike energy will affect the lightning protection system already in place. Review if upgrades or modifications are needed to mitigate the lighting risk.
—Andreas Fabricius (andreas.fabricius@aon.com) is a senior risk control consultant for AON Global Risk Consulting.