As gencos seek to improve plant reliability and availability, many are turning to on-line condition monitoring for help. Huge advances in the capabilities of on-line diagnostics have occurred over the past five years. By using this technology, plant personnel can spot early warning signs of impending equipment failure and take action to correct the underlying problem.
An Ounce of Prevention
On-line monitoring (OLM) should be part of a comprehensive asset management strategy. Early detection of operating anomalies and negative trends can reduce maintenance costs. By detecting a potential problem early, a plant can schedule the outage needed to address it when the cost of replacement power is lowest. With advance notice, repairs can be prioritized and optimally scheduled.
OLM systems based on data-driven models became feasible in the late 1990s as computer processing power became more affordable. Examples include OLM systems that use advanced pattern recognition (APR) to detect even subtle changes in a matrix of equipment operating variables such as pressure, temperature, flow, and valve position.
Data-driven APR models identify when a machine or process is behaving abnormally by trending sensor readings. If readings are consistently outside very narrow bands, a failure may be in the cards. Compared to generic OLM systems, APR-based systems are compatible with a wider range of transducers.
A typical APR-based OLM system comprises:
-
A mechanism for retrieving the readings of sensors attached to equipment.
-
A modeling engine that defines the "normal" range of expected readings.
-
A diagnostic engine, powered by logic capable of detecting an impending failure.
The system produces an actionable event list and trend displays of measured and expected values.
The historical data used to define models come from a data historian. In the early 1990s, only a few plants archived their historical data. Now, however, many do, and several commercial data historians are available that allow a user to easily import or plot values from sensors for any desired time period. These systems can supply an OLM system with historical data, as well as real-time data.
The system first receives the real-time and historical parametric readings. The two data sets are then turned over to the modeling engine, which generates an expected (modeled) value for each reading. Limits set by the designer specify how far a measured value can deviate from an expected value before action should be taken. The table lists several of these actionable limits, which are called thresholds.
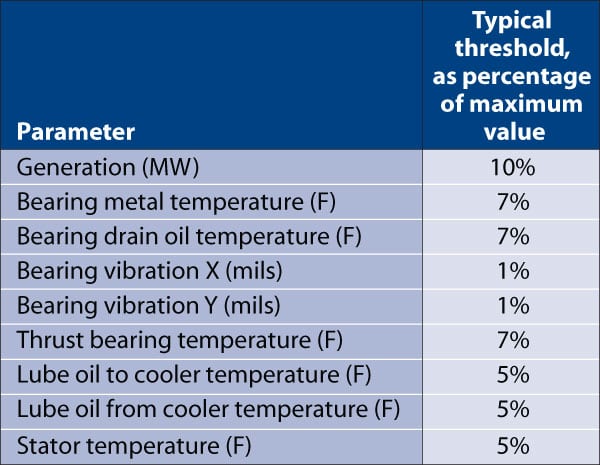
Typical thresholds for sensors. Source: Performance Consulting Services Inc.
Once a limit has been exceeded, different logic in the diagnostic engine determines if the excursion reflects the occurrence of a significant actionable event. Bad readings due to transients or the failure of an instrument problem are automatically filtered out by intelligent subroutines.
The output of the diagnostic engine is a list of actionable events corresponding to problems with a high probability of occurrence. By using the list, an asset manager can focus on impending failures and degradation of equipment, rather than search for a needle in a haystack of trend data. When all plant processes are running within acceptable limits, production becomes more reliable and profitable.
When an event appears on the list, it is referred to the engineering and operating staff (asset managers), who then assess the severity of impact on plant operations and determine what actions should be taken. As part of their analysis, they may call for additional measurements to be taken, review historical data, and/or perform additional calculations. Some newer OLM systems can ask for the data to do the required math automatically.
The process concludes with the plant owner or operator making a decision (to shut down the plant, for example) he deems most cost-effective for addressing the problem. With millions of dollars potentially at stake, it is critical that the real-time readings feeding the OLM system be reliable. Sensors are obviously the weakest link in the analysis chain. A recent study indicates that of the sensors responsible for false readings (either due to misalignment or malfunction), 45% were temperature sensors, 9% were vibration sensors, and 6% were pressure sensors. The remainder were mainly position and oxygen sensors, or other sensors of chemical concentration.
Creating Models and Rules
Using a data-driven model requires a commitment to model tuning. Assets that are less susceptible to ambient conditions require less tuning than other assets. At the beginning of a program to increase plant reliability and availability, asset tuning may seem a daunting effort. But that’s because at many plants, many sensors are not working properly. Once on-line monitoring has been implemented — helping the plant to run as designed — data-driven models can remain viable for several years with little modification.
Developing an OLM model is a three-step process (Figure 1). The first is to decide which sensors are the most important for protecting a piece of equipment. The next is to cull data from the historian that represent the equipment’s normal operation. Finally, the diagnostic engine must be programmed with the optimum sensor thresholds and the logic for filtering out bad data and false positives.
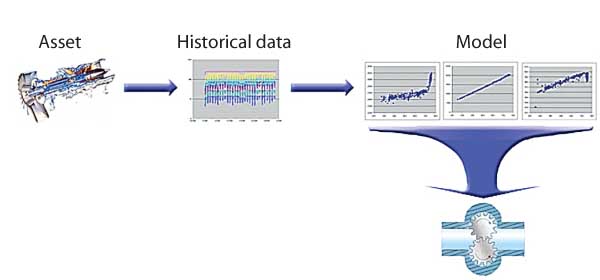
1. How on-line diagnostic monitoring models are developed. Source: Performance Consulting Services Inc.
Most pieces of large rotating equipment come equipped with speed and power-consumption sensors as well as bearing temperature and vibration sensors, whose readings OLM models can put to good use. When a sensor reading falls outside the normal window of operation, an anomaly is flagged. The logic rules in the diagnostic engine then "interpret" the anomaly. The rules are particularly sensitive to anomalies of sufficient amplitude and duration. Any anomaly that meets both criteria is then considered an "event" and posted on a watch list. The rules also can relate anomalous behavior of several sensors.
Examples of OLM’s Power
At one power plant, the motor of one of four circulating water pumps began producing slightly higher bearing temperature readings on instruments attached to the pump. Because it was winter, plant personnel didn’t consider the increase in heat a serious problem. At first, they thought the rise in temperature was caused by a sticky intake valve that often was throttled.
At the same time, the plant’s OLM system began detecting higher vibration levels on the same pump. A technician armed with portable vibration and temperature monitors was dispatched to the cooling water intake structure to verify the anomalous readings. Sure enough, after switching to another circ pump and throttling it, the instruments indicated that the temperature and vibration levels of the suspect pump were still out of range. After the pump was taken out of service and disassembled, a visual inspection determined that the inner and outer races of its thrust bearing were scored. The entire bearing needed to be replaced.
By identifying the problem early, the plant was able to replace the bearing for a total cost of less than $7,000, including the cost of replacement power. If more serious damage had occurred to the motor and/or the pump, the total cost of labor, materials, and lost generation could have exceeded $200,000.
A second case study provides another example of the power of OLM. At another plant, an APR-capable OLM system was closely monitoring the bearing temperature of a forced-draft fan to discover why the fan was running hotter than usual. Temperature readings from this fan had first become erratic during a change in plant load, suggesting that the anomaly was load-dependent. However, a closer inspection motivated by the OLM’s indication of an intermittent sensor failure confirmed that load wasn’t the culprit. The inspection revealed a different problem, which then was corrected.
A third example illustrates the advantages of OLM systems capable of advanced pattern recognition over simpler systems. When a vibration sensor monitoring a plant’s cooling tower fan began producing intermittent readings, the preliminary diagnosis was that the fan was at risk of imminent failure. But within a few weeks, the sensor — not the fan — failed catastrophically. Because the installed OLM system was only able to do a simple trend of vibration readings, it had not provided enough information to determine if the sensor was operating properly. Had the system used APR, the root cause of the problem would have been properly identified.
Centralized OLM
Another trend in OLM since the 1990s has been gencos’ use of the technology at diagnostic centers to monitor readings and provide advanced warning of impending problems across an entire fleet of plants. These OLM systems typically incorporate utility subject matter experts’ (SMEs’) knowledge of equipment failure.
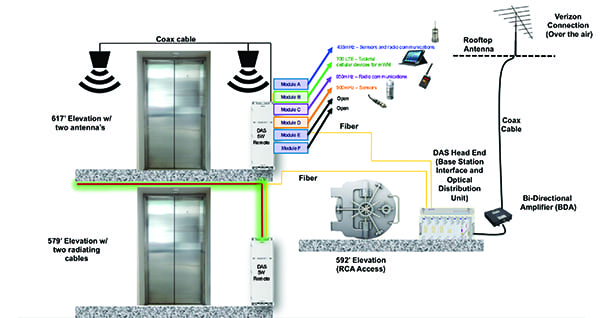
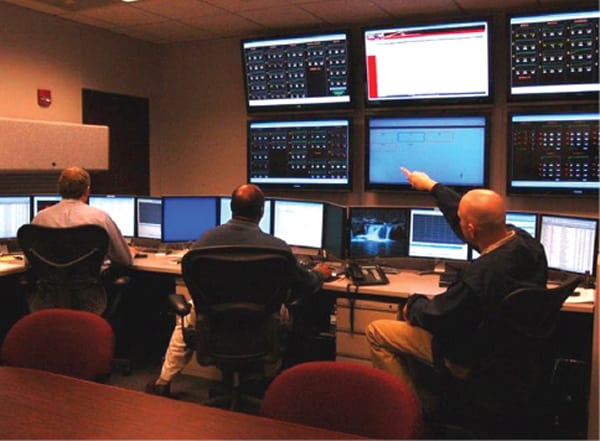
Implementing OLM at the fleet level provides the same benefits as OLM at the plant level. But with centralization, plant operators and engineers can discuss problems and share suggested solutions to them in real time. As a result of the collaborations, O&M staffs often find the right path to a solution more quickly and spend less time and money on wild goose chases. Figure 2 illustrates the concept behind a centralized diagnostic center equipped with OLM. The cost of setting up a centralizing diagnostic center and network often can be recouped quickly by reduced catastrophic failures, increased plant reliability, less money spent on replacing generation, and a lower maintenance bill.

2. A typical centralized on-line monitoring and diagnostic center. Source: Performance Consulting Services Inc.
More utilities are pooling the resources and knowledge of their plants to build centralized monitoring and diagnostic centers. Some of the centers use proprietary software developed in-house, while others prefer to use off-the-shelf applications.
OLM Cost Options
Utilities with limited budgets may consider using an external monitoring service to train the diagnostic center’s personnel. Another way to cut costs is to use off-the-shelf software developed by knowledgeable consultants. A third economic approach would be to outsource maintenance of the monitoring models and operation of the diagnostic center to a consultant. This would free up personnel for other duties.
The level at which a utility monitors its assets at the plant or fleet level is typically a function of its budget and staffing constraints. For the lowest and least expensive level of service, a consultant would be hired to regularly review the status of the generating units and report any abnormalities to the responsible asset manager. The consultant’s input would typically consist of weekly or monthly equipment evaluations and recommendations for any upcoming outages.
A more disciplined approach would entail setting up regular conference calls among the consultant, plant personnel, and the company’s SMEs. Using a teleconferencing service such as WebEx or GoToMeeting would allow every participant to see the same data on his or her screen.
This material was excerpted from a paper presented by Elmer Hanson, PhD, PE, of Performance Consulting Services Inc. (www.pcs-home.com), at the 2006 ELECTRIC POWER Conference & Exhibition.