As new power plants have become harder to permit, maintaining the performance of plants that some would consider past their prime has become more important than ever. Like a vintage coupe at a car show, an old plant that has been well-maintained doesn’t show its age. Even 40-year-old plants can deliver many more years of profitable and reliable service—if their equipment has a good health care plan.
Over the past two decades, plant owners have increasingly used equipment condition monitoring (CM) to maximize plant availability and revenue and minimize maintenance costs. Among the most popular CM systems and schemes are data historians, digital control, trending of critical operating parameters, vibration and oil analyses, and infrared scans.
However, many of these methods either focus only on whether a system is currently operating within prescribed limits or track only certain measures of performance. In both cases, human analysts must then infer overall equipment health and its direction. Newer CM systems and techniques can extrapolate readings of common plant parameters to evaluations of overall equipment health in real time. By comparing past and present readings, they can predict—fairly accurately—when a system or component will fail or begin causing problems elsewhere.
When a plant’s analytic or interpretive methods fall short, its bottom line suffers. Two scenarios, both undesirable, are possible. If systems are maintained according to strict schedules, with no regard to their actual condition, man-hours and scarce O&M dollars may be spent on repairs that aren’t yet needed. If the maintenance philosophy is too cavalier, incipient problems that should be addressed may not get fixed in time (because they were detected too late) to avert an expensive failure.
Neither too soon nor too late
Implementing predictive maintenance (PM) techniques solves both potential problems. If real-time readings of key parameters indicate that a piece of equipment is continuing to operate normally, a scheduled overhaul can be delayed, along with the cost of performing it. Conversely, slow but sure changes in readings enable analysts to detect impending failures early, before the equipment’s condition worsens to the point of needing urgent attention. Early awareness of a problem makes it possible to schedule repairs at a convenient time (for example, during an upcoming planned outage) and gives the plant’s O&M staff time to line up the team of technicians best qualified to do the work.
Although PM has become commonplace at power plants in the developed world, the technique is more likely to be applied to key million-dollar systems such as boilers, turbines, and generators than to balance-of-plant (BOP) equipment such as motors, fans, pumps, and air heaters. Using case studies, this article argues that PM programs have their greatest positive impact on plant availability and profits when they also include BOP equipment. Comprehensive PM programs can even quantify the financial losses avoided by optimizing maintenance schedules to reflect actual equipment health.
Managed care methodology
The case studies detail several instances where SmartSignal Corp.’s predictive analytics software package (also called Smartsignal) detected abnormal operation of main or BOP equipment at a power plant, enabling O&M personnel to take early corrective action. Under a contract signed in September 2004, SmartSignal installed its real-time PM system at the generating units of the fossil-fueled fleet owned and operated by a large Midwest utility.
Before we delve into the case studies, it’s worth outlining how the Smartsignal system works.
The software uses empirical models of equipment that have been built from and “trained” on historical data. Monitoring is done in real time with 10 minutes between “snapshots” of various parameters. Algorithms in the Smartsignal system determine whether any parametric behavior is questionable and post anomalous results to a “watch list”—a web-accessible folder of items worth investigating (Figure 1). An analyst can then judge whether any item represents a problem that warrants immediate corrective action—while the piece of equipment and its generating unit remain on-line.
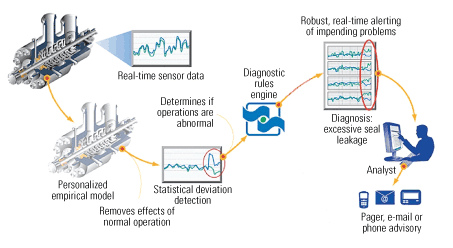
1. From raw data to actionable intelligence. Data from key sensors are collected and filtered to create an empirical model of all the normal and expected operational states of the equipment or system monitored. During live monitoring, snapshots of data are compared with the model to generate estimates and residuals. Any alerts created from too-high or too-low residuals are then passed through a diagnostic rules engine. If the alerts are persistent or multiple sensors are alerting in a way that fits a known fault pattern, an incident is created that is posted to a web-based watch list for the predictive monitoring analyst to evaluate and take action on. The time between the first posting of an item to the watch list and when an operator must react to an equipment problem is called the “early warning period.” Source: SmartSignal Corp.
Conventional CM systems compare the readings produced in real time by pressure, temperature, flow, speed, and vibration sensors to predetermined upper and lower thresholds. If a reading is higher or lower than it should be, the system triggers an alarm, shuts down equipment, or both. The thresholds are carefully set by experienced operators to be wide enough to minimize unnecessary alarming but narrow enough not to miss potential failures that may be catastrophic. However, because the limits must encompass the broad range of equipment operation and states, CM algorithms may lack the sensitivity to pick up subtle sensor deviations from normal that could signal an incipient equipment failure.
The CM techniques used in the Smartsignal program are unique because they use all sensor readings to determine the current state of equipment. For example, the instruments dedicated to independent drivers (such as controllers, material inflow, and ambient conditions) and those monitoring dependent responses of the system (including exhaust gas temperature and material outflow) are grouped together in a single model.
During monitoring, one algorithm assembles a sample snapshot from the readings of all individual sensors in the model at the exact same time. This “actual” snapshot is then compared to the model, which uses data embedded in it to create estimates of the normal readings expected to be produced by sensors with the equipment in its current operating state.
For each operating parameter, the difference between the actual value and the estimated normal value is called the residual. Another algorithm then tests the residual to determine whether it is reasonably small—in other words, whether the actual value is close to the expected normal value.
When the residual is relatively small, the sample is considered normal. When the residual is relatively large, the sample is considered suspect and triggers either of two actions. If only one parametric reading is yielding a high or low residual, the system signals an “alert” for that moment in time and notes it on that parameter’s graphic display. If there are persistent deviations in multiple sensor readings that match a known fault pattern, the system determines that an “incident” is occurring and creates an item for addition to the watch list.
Problems, large and small
Now, the case studies. As mentioned, they detail incidents and alerts “caught” by Smartsignal at 16 individual generating units. Table 1 lists the assets (main and BOP) monitored and the models used at the typical coal plant. Of the 16 units (which have a total capacity of about 4,100 MW), eight burn pulverized coal, seven are simple-cycle combustion turbines that fire natural gas, and one is a gas-fired combined-cycle unit.
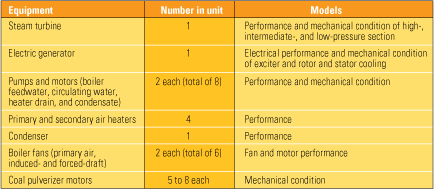
Table 1. Assets typically monitored at a coal-fired generating unit and the empirical models used to do so. Source: SmartSignal Corp.
The 16 installations, including empirical models, were completed in December 2004, and shortly thereafter the system began live monitoring of the fleet at a 10-minute sampling rate.
Within the first few months of live monitoring, Smartsignal found compelling evidence of several potential equipment problems at the larger coal plants and posted them to the watch list. Following are four abnormal conditions detected on major equipment (turbines and generators):
- At the 600-MW-class Plant A, lube-oil temperatures of the system for cooling bearings of the unit’s steam turbine were behaving erratically. Technicians attributed the problem to an improperly tuned control valve in the system’s water cooling circuit. The early warning and subsequent retuning avoided a potential thermal cycling of the bearings.
- At the same plant, Smartsignal detected low hydrogen pressure in the electric generator. This early warning and subsequent corrective action avoided a potential overheating of the generator.
- The Smartsignal at Plant A also noted that the vibration residual for steam turbine bearing #7 was slowly rising. When the condition appeared on the watch list on February 7, 2005, operators responded immediately by placing the bearing vibration signal in bypass mode, to prevent the turbine control system from tripping the unit for excessive vibration. Vibration levels continued to rise, with the residual reaching 8 mils on March 7. Eventually, the vibration problem was eliminated during a planned outage. However, the generating unit might have tripped unnecessarily had operators not put the bearing vibration trip signal in bypass.
- One day, at the 800-MW-class Plant C, the generator exciter’s field amps and volts experienced substantial surges that were noted by Smartsignal. The initial diagnosis was shorted turns in the rotor. As a result of the early warning, the exciter was inspected during a planned unit outage two weeks later and was indeed found to need a rewind. In this instance, the early warning avoided the need for an unplanned outage.
Monitoring catches weren’t limited to major equipment. Although BOP catches are not as dramatic, they are just as critical to maintaining plant reliability. In addition, they are more impressive because fans, motors, and pumps are usually less well-instrumented than turbines or generators.
The BOP catches made within the first few months of Smartsignal going live included the following:
- At the 700-MW-class Plant D, the induced-draft fan’s shaft coupling set screw was found to be loose and causing amps to cycle high and low. The early warning avoided a possible forced outage because the lack of proper ID fan control may have eventually caused a unit trip for unstable draft.
- Smartsignal determined that the bearing of one of Plant D’s two cooling water pumps was starved of cooling water. A subsequent inspection found that the cooling system’s operation was biased to the other pump, causing a rise of 30 to 70 degrees F above normal in the bearing temperature of the first pump. In this case, the early warning avoided potential bearing damage and a forced outage to replace the pump’s motor.
- Similarly, Plant D’s secondary air heater support bearing was found to be starved of oil, causing bearing temperatures to rise 40 degrees F above normal. Here, too, the early warning avoided a potential bearing failure and an unplanned outage.
- At Plant C, Smartsignal sounded an air preheater alarm and added an item to the watch list when it detected excessive pressure due to erratic control of steam pressure. The lack of control—which meant that the air preheaters were not using properly conditioned steam—reduced the preheaters’ efficiency.
- At Plant A, the outboard bearing of the primary air heater motor was found to be starved of oil.
- One of Plant D’s pulverizer mill thermocouples was found to have been wired backward during a maintenance overhaul.
Inside two catches
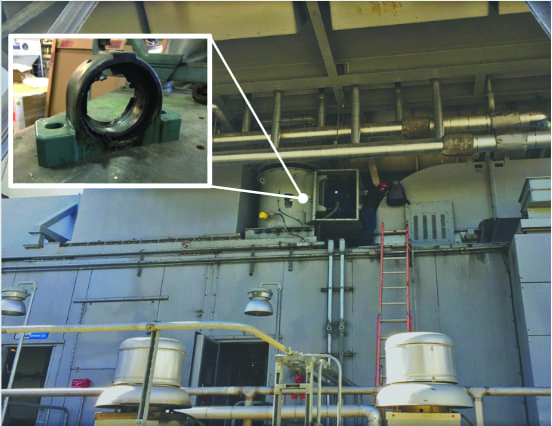
Let’s examine the specifics of two cases where the use of the CM and PM methods described above avoided an unforced outage to replace an air heater bearing. The first catch was made and put on the watch list for Plant D on February 1, 2005. The residual value of the support bearing temperature increased 10F to 40F above the expected value during the next week (Figure 2). A SmartSignal analyst determined that the bearing was oil-starved.
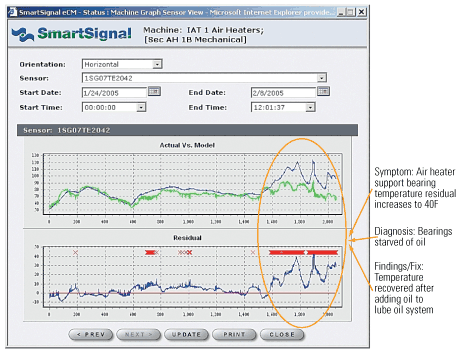
2. Bearing down. This screen shows the predictive monitoring graphs of Plant D’s secondary air heater B support bearing temperature from January 24, 2005 to February 8, 2005. On both plots, the y-axis shows sensor temperature and the numbers on the x-axis are sample numbers. On the top plot, the blue line indicates actual values and the green line is estimated values. On the bottom plot, the blue line shows residuals, the red line marks the zero baseline, and red Xs represent alerts. Source: SmartSignal Corp.
The top graph of Figure 2 shows the actual sensor value (blue) and the estimated value (green) for the period of January 24 to February 8. Over most of the period, the two values are similar, between 50F and 90F. After February 1 (or around Sample 1600 shown on the plot), the actual value rises to as high as 120F (yet is still far below the conventional monitoring upper threshold limit of 150F), while the estimate stays at or below 90F. The bottom graph shows the residual value (actual minus estimate), which has a mean value of zero and a normal range of about ±10F. After Sample 1600, the residual rises to as much as 40F above the zero baseline.
The problem was easily solved by adding 3½ gallons of oil to the bearing lubrication/cooling system (of 25- to 30-gallon capacity), which quickly brought the temperature back within spec. This air heater’s support bearings have a very narrow range of acceptable oil levels as well as a history of operating problems. This catch led to corrective action that avoided a possible bearing failure and an unplanned outage for repairs.
Plant D had suffered an air heater support bearing failure once before, on July 24, 1998. The bearing took nine days to replace. During that time, according to North American Electric Reliability Corp. data, the utility lost 138,800 MWh of generation. Because the production cost of this unit ranges from $10 to $30/MWh, the utility lost between $1.4 million and $4 million by not having a CM system on-line.
A second catch of abnormal air heater bearing temperature was made at Plant A and put on its watch list on December 10, 2005. Over the next five days, the residual value of the guide bearing temperature increased 20 to 25 degrees F above expected values (Figure 3).
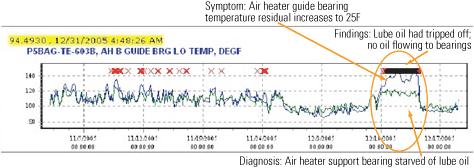
3. Residual effect. This screen shows predictive monitoring graphs of air heater guide bearing temperature at Plant A from December 10 to 15, 2005. On the top graph, the blue line indicates actual values and the green line estimated values. The red Xs represent alerts and the black bar (actually consisting of black diamonds grouped close together) indicates when the incident was placed on the watch list. Source: SmartSignal Corp.
The graph shows the actual sensor value (blue) and the estimated value (green) for the period of December 10 to December 15. During most of the period, these two values are similar, between 90F and 130F. But around midnight on December 10, the actual oil temperature increased to 145F while the expected temperature was at or below 120F. Note that the actual value never reached the conventional monitoring upper threshold limit of 150F that would cause the unit’s distributed control system to sound an alarm.
As in the previous case, a SmartSignal analyst diagnosed the problem as an oil-starved bearing. Technicians at Plant A determined that the lube oil pumps had tripped and cut off the flow of oil to the air heater’s bearings. Once again, the catch and corrective action avoided a possible bearing failure and a forced outage.
The great value of good health
Analyzing the value of a PM system requires making an educated guess of how much unplanned maintenance can be shifted to planned maintenance by having early warnings of impending problems (Table 2). Each catch of a potential equipment problem will reduce maintenance expenses if it is determined that it is safe to delay any needed repairs until the next scheduled unit outage. If that is the case, the repairs will cost less (because they will not require overtime payments and are likely to be less complex because the equipment was not run until it failed), there will be no losses of generation revenue, and there will be no need to pay spot-market prices for replacement power.

Table 2. Estimated savings from early warnings of equipment failure at a 500-MW coal-fired power plant. Source: SmartSignal Corp.
—Donald S. Doan (ddoan@smartsignal.com) is a senior power plant specialist with SmartSignal Corp., a supplier of computer-based applications for analyzing and predicting the operating condition of industrial assets.