After Hurricane Michael made landfall near Mexico Beach, Florida, as a category 4 storm on October 10, it moved across Georgia, South Carolina, North Carolina, and southeastern Virginia on October 11, and finally out into the Atlantic on October 12.
According to the U.S. Department of Energy’s Infrastructure Security and Energy Restoration office, the storm caused significant damage to portions of the Florida Panhandle and southwestern Georgia, leaving numerous power outages across the affected region.
The power industry scrambled to aid restoration efforts. Mutual assistance networks sent, at peak, 36,000 personnel from 27 states, to help storm-stricken utilities meet resource needs.
At about 4 p.m. EDT on October 11, Michael, downgraded to a tropical storm, was 20 miles north-northwest of Raleigh, North Carolina, moving northeast at 24 miles per hour (mph), with maximum sustained winds of 50 mph. Nearly 1.2 million customers sustained electricity outages. Most were in Georgia, where 6% (424,744 customers) of total customers in the state had no power; Florida, where about 4% (400,666 customers) of total customers had no power; and North Carolina, where 9% (361,879 customers) of total customers in the state had no power. Among the most significantly impacted utilities were Gulf Power, Tallahassee Electric, Georgia Power, and Duke Energy.
By 5 a.m. EDT on October 12, Michael, now a “post tropical cyclone,” was 185 miles east-northeast of Norfolk, Virginia, moving at 29 mph with maximum sustained winds of 65 mph. A total 1.7 million customers across a large swathe of the Southeast—including in Alabama, Florida, Georgia, North Carolina, South Carolina, and Virginia—still had no power at the time. The DOE estimated that 14% of Virginia’s total customers (572,666 customers) had lost power. Most were Dominion Power customers.
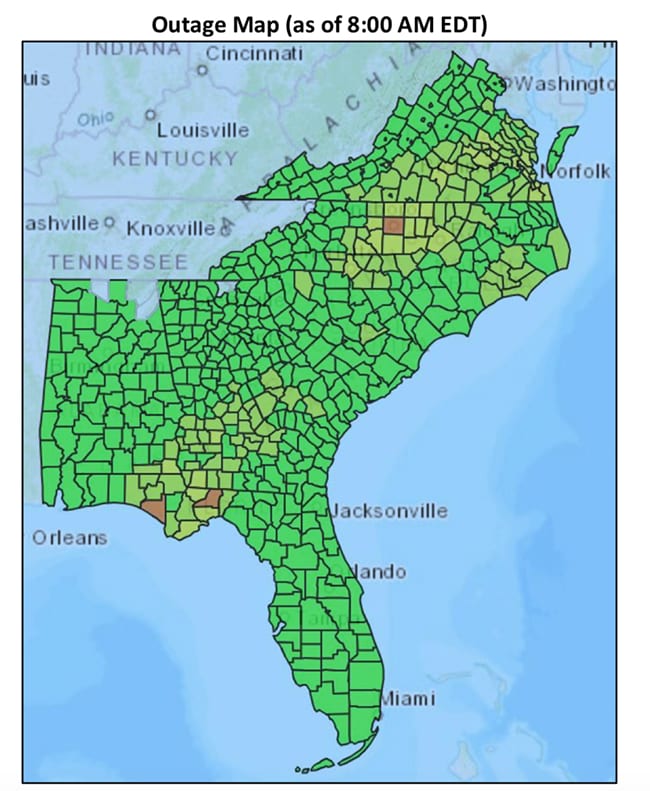
By October 19, restoration efforts were still underway, and the DOE expected that the hardest-hit areas could require partial system rebuilds. However, 98.9% of customers in Florida and 99.5% of customers in Georgia had power.
The storm’s rapid decimation of grid infrastructure was captured through “night light” images taken by National Oceanic and Atmospheric Administration (NOAA’s) NOAA-20 satellite. The image of the left, which was taken on October 6, at about 2:58 a.m. EDT, shows the area where the Florida Panhandle meets Georgia. The image on the right was taken on October 12, at 2:45 a.m. EDT, as the storm headed back into the Atlantic.
A satellite view of Michael’s power outages. Move the slider to view power outages caused by Michael in the Florida Panhandle and Georgia, which was one of the hardest-hit regions on the storm’s track. Courtesy: NOAA/NASA/POWER
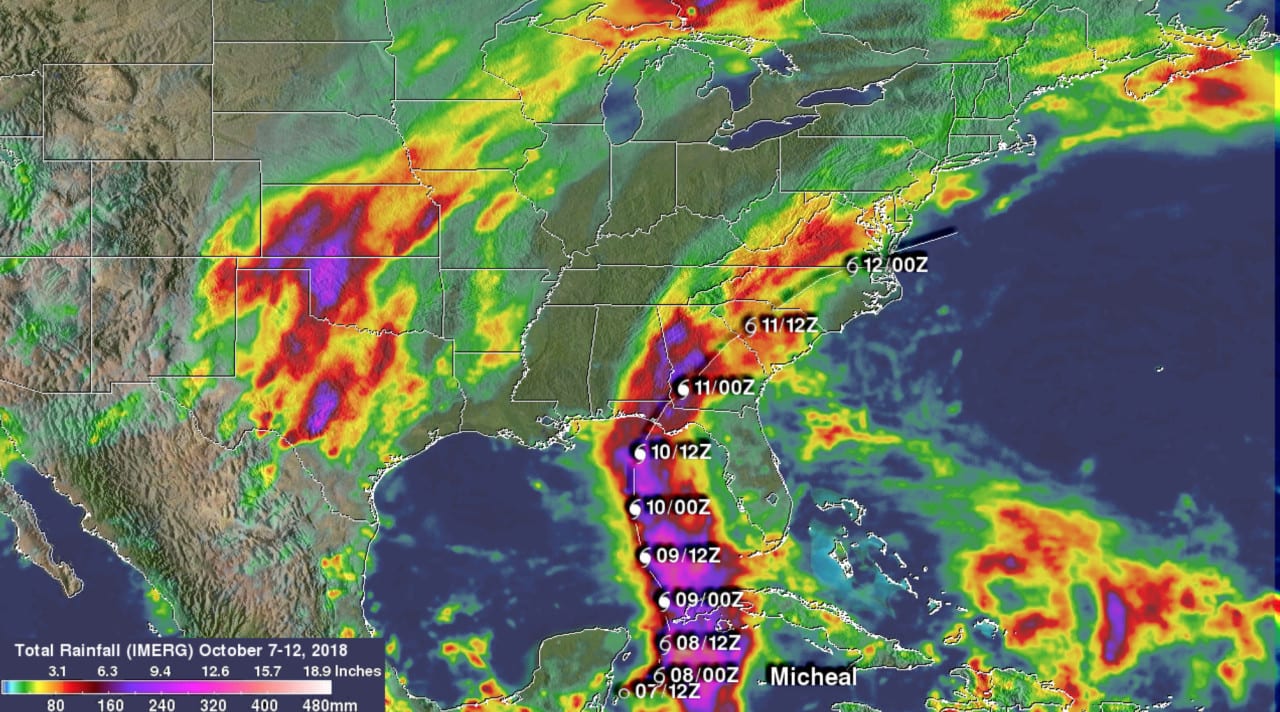
To get a sense of Michael’s reach and intensity, here is an image from NASA’s Goddard Space Flight Center, which is derived from NASA’s Integrated Multi-satellitE Retrievals data (IMERG). The image shows rainfall accumulation estimates along Michael’s track during the period that the storm became a tropical depression 14 miles off the coast of the Yucatan Peninsula on October 7 until it passed off the U.S. East Coast on October 12.
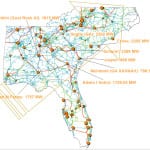
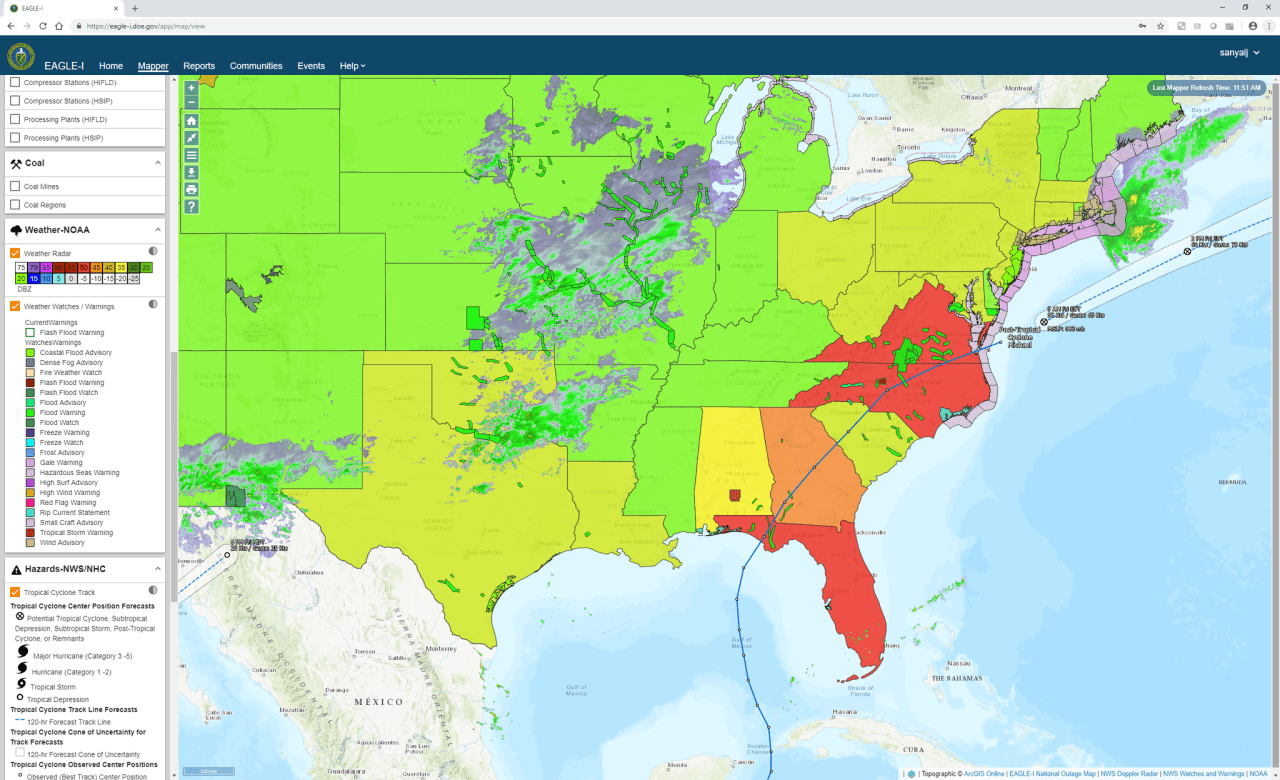
This image from the Environment for Analysis of Geo-Located Energy Information (EAGLE-I) system—used by federal, state, and local agencies, and first-responders, shows the devastation left in Michael’s wake. The EAGLE-I real-time situational awareness tool, developed by the DOE’s Office of Electricity, monitors energy infrastructure assets, reports energy outages, and displays potential threats to energy infrastructure. Oak Ridge National Laboratory (ORNL) now manages the service, and has millions of dollars in DOE funding to improve it.
—Sonal Patel is a POWER associate editor (@sonalcpatel, @POWERmagazine)
Note: Updated on November 3 to include the Eagle-I image.