How would you like to be able to access data on all the power plants in the world and all of their performance metrics, analyze that data, and map it? Those abilities are part of the vision behind the Global Energy Observatory (GEO), an OpenModel website that serves as a wiki for global energy data.
Like Wikipedia, this enterprise uses wiki software that allows for the creation and editing of interlinked web pages by a collaborative community of users. GEO seeks to "promote an understanding, on a global scale, of the dynamics of change in energy systems, quantify emissions and their impacts, and accelerate the transition to carbon-neutral, environmentally benign energy systems while providing affordable energy to all." It is attempting to do so by using open source software tools, including Google Earth, and encouraging community participation. That’s where the power generation community comes in.
GEO’s databases are organized into three categories: GEOpower for power generation, GEOresources for fuels and resources, and GEOtransmission (under construction) for the transmission of electricity and fuels. The GEOpower database can account for coal, gas, geothermal, hydro, nuclear, oil, solar PV, solar thermal, waste, and wind plants of all sizes, though to date it includes mostly utility-scale plants for which public data are available.
The project was conceived and developed by Dr. Rajan Gupta, a fellow of Los Alamos National Laboratory and a theoretical high energy physicist with wide-ranging research interests. It is sponsored by the New Mexico Consortium and has been built primarily by Gupta and four University of New Mexico electrical and computer engineering masters students.
A Virtual World of Information
Although GEOpower contains information on many power generation facilities around the world, the initial data have come from publicly available sources, so plant entries are necessarily incomplete. The GEO website explains that the project developed scripts to "scrape data available from open credible websites and publications in different formats (Excel, html, KML, pdf) into the database." Data for U.S. plants, for example, have been imported from Energy Information Administration and Environmental Protection Agency (EPA) sources. Gupta estimated that by the end of May, GEOpower included 40% to 50% of global power generation capacity.
The GEOpower home page includes links to tools that allow you to map data, view and edit data, add a plant, view the history of edits, download data, and analyze data. If you map all hydro plants in India, for example, you can click on any plant location to see capacity, and then click into the database for additional information.
Users must register and log in to edit and add data, use analysis tools, and download data so that the consortium representatives "can track and validate changes, and work with and acknowledge high quality users."
Because the majority of data included to date came from official sources, they are considered prevalidated. Gupta told POWER that when considering data from other sources, the system will be analogous to a peer review system used by scientific journals: "the editors and moderators in this system would be subject area experts."
Data analysis looks as if it could be very interesting when the database is more fully populated. The interface includes 25 performance metrics, from gigawatt-hours generated to NH3 (ammonia) emitted. Currently, data are typically limited to metrics tracked by regulatory agencies (for example, seven years of the EPA’s eGRID data for U.S. plants).
Drilling Down into the Database
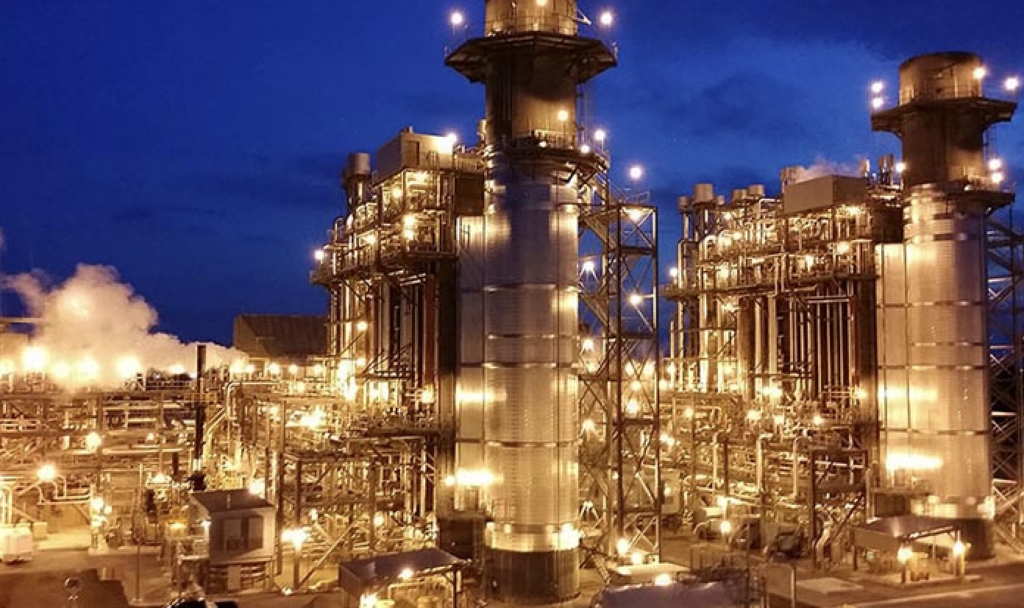
To test the database, POWER searched for the small Valmont Station in Boulder, Colo. (Figure 1). GEOpower shows the plant as being owned by Public Service Co. of Colorado (an Xcel Energy subsidiary), having a design capacity of 236.9 MWe, firing bituminous coal as its "primary fuel," and using water from Boulder Creek. It also includes the commissioned date for both units. Performance data as of mid-June were GWh generated; heat input; and CO2, SOx, NOx, and mercury emissions. (Interestingly, GEO shows — as does the EPA’s original eGRID data, according to Gupta — CO2 emissions increasing between 2000 and 2004 even though gigawatt-hours generated dropped.)

1. Getting a grip on global energy data. The collaborative Global Energy Observatory seeks to provide easy access to data on all energy systems around the globe. To date, this work in progress includes publicly available information on power plants in nine countries. This screen shot shows the interface for selecting a plant whose data you want to examine and/or edit. Source: New Mexico Consortium
For comparison, we looked at information on Xcel Energy’s Valmont Station website, which gives 229 MW as the plant’s size and "low-sulfur coal from western Colorado mines and natural gas" as its fuels. Xcel also provides the following information about the plant: "Unit 5 (V5) went into service in 1964 and can burn either coal or natural gas. The unit uses three surrounding lakes for circulating cooling water. Unit 6 (V6) began generating electricity in 1973." (It also includes the interesting historical note that when Unit 1 — no longer operating — went into service in 1924, Valmont was the largest power station west of the Missouri River.)
Plant Manager Mark Fox confirmed that Unit 5 burns gas when the economics of doing so are favorable. He also resolved the apparent discrepancy in water source by noting that cooling water comes from reservoirs (also called lakes) that are fed by Boulder Creek.
Xcel notes that Valmont Station is the company’s most efficient power plant. Unit 5 has a scrubber to reduce SO2 emissions, low-NOx burners to reduce NOx emissions, and a baghouse that removes particulate emissions from the flue gas by more than 99%. (GEOpower includes fields for "Type of SOx First Control Device," "Type of NOx First Control Device," and "Type of Mercury Control Device," but those were empty fields for Valmont.) The reservoirs used for cooling water have also been recognized as a wildlife refuge, and the plant was chosen by Audubon Colorado as the first important "Bird Area" in Boulder County. Some of that qualitative information would be invisible to GEOpower, which doesn’t acknowledge that Unit 5 can switch fuels. Gupta noted that GEO allows users to "correct mistakes and add missing information."
When asked how GEOpower would account for changes in equipment (including emissions control systems) and hours run year-over-year as those factors affect emissions, Gupta responded that the analysis will correlate those data. "Whether we will be able to get all the data needed is an open research question."
"We hope that GEO becomes a ready reference for journalists and advocacy groups that come to appreciate the value of structured scientific information that is available from one place," Gupta told POWER. "Our goal is not to be antagonistic to power companies and their associated partners but to provide a forum for a scientific discussion and analysis that leads to cheap, clean energy for all. GEO is designed to highlight efforts by industry to take innovative steps towards this."
Gupta, who clarified that GEO "is still a research project and not a finished product" also noted that "the more complete the picture is, the more information we can infer, and this inferred information can then become the starting point for validation through the wiki process."
To add a new plant to the database, or to provide additional or correct data for your plant, register at http://openmodel.newmexicoconsortium.org.
—Gail Reitenbach is POWER‘s managing editor.