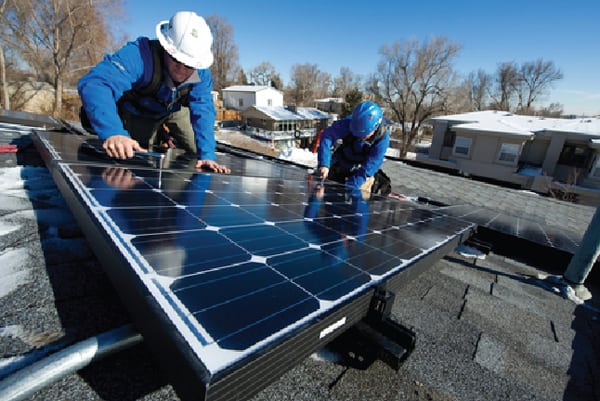
Utility-scale solar photovoltaic (PV) generation has exploded over the past few years. From nearly nothing in the late 2000s, the U.S. now has more than 10 GW of utility-scale solar PV in operation according to the Energy Information Administration. That figure should continue to grow strongly because of the recent extension of the investment tax credit.
But the utility PV sector is not without its challenges. The crash in panel prices has brought with it a commensurate drop in prices for solar-generated electricity. That’s made sound financial and risk planning essential for new projects, but that planning is complicated by uncertainties in long-term performance.
Solar PV Capacity Factors Inconsistent, Unpredictable
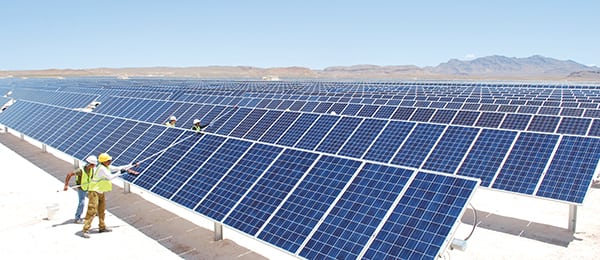
As analytical methods and data on solar PV generation improve, it’s become clear that there are wide variations in capacity factors across the industry. Further, simply siting a solar project in a historically sunny spot doesn’t necessarily guarantee a high capacity factor, not just because solar irradiance can vary quite widely over time (Figure 1) but also because other factors affect a plant’s production.
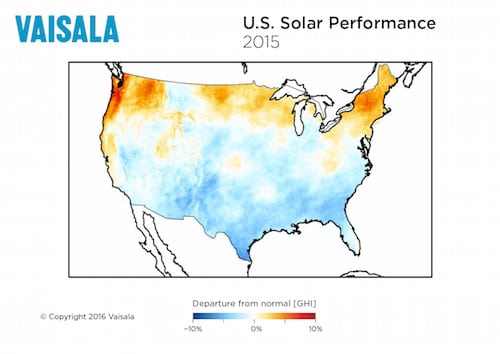
- Cool down. Environmental data firm Vaisala reported on March 1 that solar irradiance in the U.S. was well below average for much of the nation in 2015. Courtesy: Vaisala
Quantifying these factors has been difficult, however. Addressing that challenge was the goal of a new study released on March 4 by the Lawrence Berkeley National Laboratory (LBNL), “Maximizing MWh: A Statistical Analysis of the Performance of Utility-Scale Photovoltaic Projects in the United States.”
The study, which was funded by the U.S. Department of Energy’s SunShot Initiative and has been submitted to the journal Progress in Photovoltaics: Research and Applications, presents the first known use of multivariate regression techniques to statistically explore variation in utility-scale PV project performance across the U.S. The researchers analyzed 2014 data from 128 utility-scale PV projects (totaling 3,201 MW) that ranged in size from 5.2 MW to 250 MW. Within that group, net capacity factors varied by more than a factor of two, from 14.8% to 34.9%.
Insolation Rules but Design Matters
Why the big range? The authors considered four possible drivers of solar PV capacity factor: global horizontal irradiance (GHI); tracking vs. fixed tilt; inverter loading ratio (ILR, the ratio of the DC capacity of the panels to the AC capacity on the grid, usually around 1.25); and the year the project first came online. They also considered three interactive variables to see how some of the factors related to one another: tracking x GHI; tracking x ILR; and GHI x ILR.
Not surprisingly, GHI was the most significant factor, but it was by no means the only one that mattered. Analysis of the data and development of a predictive model established that three of the variables—GHI, tracking, and ILR—could explain 92% of the variation in capacity factors, with GHI alone able to explain 71.6%.
Adding the year of operation and the three interactive variables improved the model further and revealed some interesting relationships.
Newer projects showed higher capacity factors, but the improvement year-over-year when controlling for the other elements was slight—about 0.23%. With a consistent GHI and ILR, however, the addition of tracking had a significant positive effect, improving capacity factor by 4.05%. The interaction of GHI and tracking, meanwhile, was fairly intuitive—the greater the GHI, the greater the benefit of adding tracking, since there was more insolation to capture.
The affect of ILR was also significant, but it experienced diminishing returns as the ratio increased. For both fixed-tilt and tracking projects, capacity factor increased by 1.00% when ILR was increased from 1.05 to 1.10, but by only 0.73% from an ILR of 1.45 to 1.50. This reflects the fact that high ILRs capture quite a bit more insolation that the inverter sends to the grid, resulting in a flatter generation profile (the excess is “clipped off” by the inverter).
“In other words,” the study notes, “if a project’s diurnal generation profile is already fairly flat due to a high ILR, then the incremental ability of tracking to increase generation during the shoulder periods should be reduced.”
The study also found that GHI and ILR had net positive influences on each other: The benefit of a higher ILR increased at higher GHI, and the benefit of a higher GHI increased with higher ILRs (Figure 2). “The [capacity factor] benefit of a higher GHI increases with higher ILRs, as the latter is better able to capture the former.”
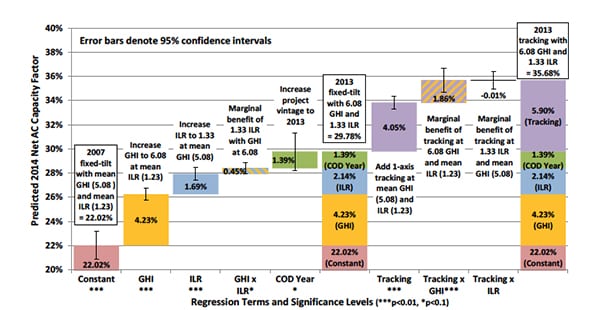
- Building blocks. This figure from the LBNL study of solar photovoltaic project performance illustrates how global horizontal irradiance (GHI), inverter loading ratio (ILR), and tracking affect solar PV capacity factors. Courtesy: LBNL
The authors suggest that the model could be further improved by considering site temperature and module orientation, but the lack of good data prevented consideration in this study. The addition of on-site storage should also improve performance, they noted, but this was also not considered.
A 50% Solar PV Capacity Factor?
The study results also suggest that future solar PV capacity factors could be improved beyond current maximums by the use of dual-axis tracking and even higher ILRs. Dual-axis tracking is a new development that was not deployed recently enough for inclusion in this study, but several projects using it have come online in the past year.
One of the study authors, Mark Bolinger of LBNL, who spoke to POWER via email, said the results also indicate ways of improving profitability of projects in areas with less-than-optimal GHI.
“In areas with lower GHI, like the northeast U.S., dual-axis tracking could actually make some sense as a way to increase capacity factor, by boosting the plane-of-array irradiance. I live in New Hampshire, on the border of Vermont, and see lots of dual-axis tracking systems around; most are built by two Vermont-based companies,” he said. “Even though lower-GHI areas won’t generate as many solar megawatt-hours, PV projects in those areas might still make economic sense if the PPA price is high enough. For example, here in New England we pay relatively high electricity prices, which tends to make up for (at least to some extent) the lower amount of irradiance that we get.”
The potential use of ILRs above 1.50 is a possibility many in the solar industry are already looking at, and some experts expect to see projects with ILRs as high as 2.0 in the next few years, though current inverter technology is not quite there yet. And, as the study noted, there are diminishing returns from ever-higher ILRs.
“With slowing module price declines, increasing (at least on a relative sense) inverter cost declines, and very low power purchase agreement (PPA) prices, there is perhaps less economic incentive to oversize the array than there has been in the past,” Bollinger said. “The optimal ILR level is determined by the marginal increase in revenue (a diminishing return, due to eventual clipping) divided by the marginal increase in cost of oversizing the array. Wherever that ratio reaches its maximum point and then starts to decline is the optimal ILR level (from an economic perspective).”
Low solar PV capacity factors relative to other forms of generation have been a common criticism directed at renewables, but the study suggests that while ideally sited and designed PV systems currently only reach capacity factors in the high-30s, capacity factors of 40% to 45% or even higher are not out of reach. That would be a significant achievement in a power sector that saw the average capacity factor of the U.S. coal fleet drop to 43% in December.
—Thomas W. Overton, JD is a POWER associate editor (@thomas_overton, @POWERmagazine).