This is the fifth in a series of predictive maintenance (PdM) articles that began in the April 2011 “Focus on O&M” in which the essentials of PdM were introduced. In the May and June 2011 issues, we explored specific PdM techniques, such as motor-current signature analysis and oil analysis. In the November 2011 issue, we introduced the value of thermographic analysis and its routine use. This installment focuses on ultrasonic and vibration analysis.
Ultrasonic (UT) Analysis
Most machines emit consistent sound patterns under normal operating conditions. These sound patterns—sonic signatures—can be defined and recognized, and changes in these signatures can be identified as components begin to wear or deteriorate. This enables technicians to identify and locate bearing deterioration, compressed air or hydraulic-fluid leaks, vacuum leaks, steam-trap leaks, and tank leaks.
Evaluation of long-term UT analysis trends can identify poor maintenance practices such as improper bearing installation or lubrication, poor steam-trap maintenance, and improper hydraulic seal or gasket installation. Long-term UT analysis can also identify machines that are being operated beyond their original design limitations, inadequately designed machines, or consistently poor-quality replacement parts.
If you want to know what a poorly operating steam trap sounds like, an excellent sound analysis library can be found at http://tinyurl.com/73ylgyp.
Ultrasounds are defined as sound waves that have frequency levels above 20 kHz—higher than what the unaided human ear can normally hear. Airborne ultrasound operates in the lower UT spectrum of 20 to 100 kHz. Small objects easily block airborne ultrasounds, and ultrasounds will not penetrate solid surfaces (though they will go through cracks). Because airborne ultrasound radiates in a straight line, its source can be relatively easy to locate. Though they do not travel a great distance, airborne ultrasounds can be readily differentiated from audible plant noise.
A compressed gas or fluid forced through a small opening creates turbulence with strong ultrasonic components on the downstream side of the opening. Although most of the audible sounds of a pressure leak may be masked by ambient noise, the ultrasound will still be detectable with a scanning ultrasound device. Therefore, when the PdM technician scans the side of a pressure vessel, a leak will produce a definite increase in ultrasound volume. Scanning is most effective when the UT instrument is close to the surface being inspected; however, it can also be done at a distance by increasing the sensitivity setting. This is particularly useful when the pressurized gas is dangerous, or when the technician must inspect overhead pipes or locations that are not readily accessible.
Vacuum leaks produce turbulence similar to pressure leaks; however, the ultrasound is generated within the system. Some of the sound escapes through the opening, though the amplitude is much lower than that of a pressure leak. This is not a problem, because the instrument can be placed closer to the vacuum leak or the sensitivity can be increased. Poorly seated valves can also be detected. When the technician touches the contact probe to the body of a leaking valve, the sound of dripping or squirting fluid will be heard in the earphones. Also, the noise from a leaking valve will be more evident on the downstream side of the valve (Figure 6).
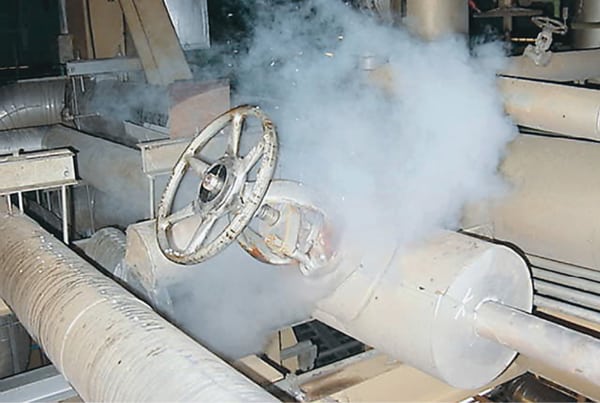 |
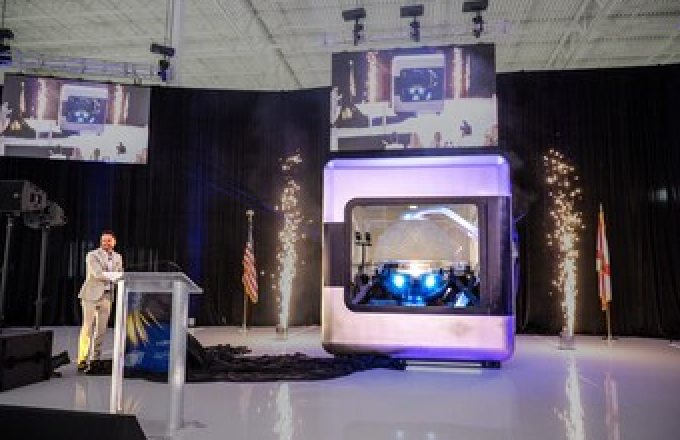
| 6. Expensive leaks. The cost to repair a leaky valve is often many times the cost of the additional fuel consumed to produce the lost steam. Courtesy: Valvtechnologies |
Spot-checking a point is used primarily when personnel detect unusual noises or reduced equipment performance and want to know if a problem exists. Spot-checking can be cost-effective for less-critical equipment, particularly when budgets or manpower are limited. Its effectiveness relies heavily, however, on someone detecting unusual noises or performance problems, a practice that may not be reliable on large or complex machines or in noisy parts of a plant. Monitoring machinery on a periodic basis (once a month or once a quarter) can provide a more subtle indication of seal or packing wear, steam-trap contamination or deterioration, or cracks in tanks or piping. This allows personnel to project acceptable performance into the foreseeable future.
Advance notice of problems means that they can be repaired during normal shutdowns, rather than resulting in a catastrophic failure that causes unscheduled down time. If problems are detected when they are minor, they are often less expensive to repair.
UT analysis is one of the less-complex and less-expensive predictive techniques. Its simplicity is directly related to the size and ease of use of handheld detectors as well as the relatively straightforward presentation of measurement data on meters or digital read-outs. The cost of the equipment is moderate, as is the amount of training required for its use. The technique is limited to applications that produce measurable ultrasounds: hydraulic, compressed air, steam, or vacuum systems.
Some companies report saving thousands of dollars in compressed air costs by reducing or eliminating relatively minor leaks. Identifying more substantial leaks can provide savings of tens of thousands of dollars. Another company estimates that a single steam-trap failure in the open position can cost up to $2,000 a year in excessive energy consumption. With savings of this magnitude, an investment in UT analysis can have a payback period of a year or less.
Vibration Analysis
Vibration analysis is used to determine the operating condition of rotating equipment, identifying incipient problems before they cause serious failures and unscheduled downtime. This can include deteriorating or defective bearings, mechanical looseness, and worn or broken gears. Vibration analysis can also detect misalignment or unbalance before these conditions result in bearing or shaft deterioration. Evaluation of long-term vibration analysis trends can identify poor maintenance practices such as improper bearing installation, inaccurate shaft alignment, or imprecise rotor balancing. (See “A Permanent Solution to Generator Vibration Problems,” April 2006; “Solving Plant Vibration Problems,” May 2006; and “Restraining Torsional Vibration,” March 2010 in POWER’ s archives at https://www.powermag.com.)
All rotating machinery produces vibrations that are a function of the alignment and balance of the rotating parts. Measuring the intensity of vibration at specific frequencies can provide valuable information about the preciseness of shaft alignment and balance, the condition of bearings or gears, and the effect on the machine of resonances from housings, piping, and other structures. It is an effective, nonintrusive method to monitor machine condition during startup, shutdown, or in normal operation.
Vibration analysis is used primarily on such rotating equipment as steam and gas turbines, pumps, motors, compressors, paper machines, rolling mills, machine tools, and gearboxes. Recent advances in the technology now allow limited analysis of reciprocating equipment such as large diesel engines and reciprocating compressors.
A vibration-analysis system usually consists of five basic parts: signal pickup(s), a signal-recording device, a signal analyzer, analysis software, and a computer for data analysis and storage. These basic parts can be configured as a continuous online system, a periodic analysis system using portable measurement and diagnostic equipment, or a multiplexed system that samples a series of points every few minutes. Hard-wired and multiplexed systems are more expensive per measurement point, so the determination of which configuration is more practical and economical will depend on the critical nature of the equipment and the value of continuous or semi-continuous measurement data for that particular application.
Spot-checking is used primarily when maintenance or operations personnel detect unusual noises or vibrations and want to determine if a serious problem actually exists. If a problem is detected, additional spectral analyses can be made to define the problem and estimate how long the machine can continue to operate before a serious failure occurs (Figure 7).
 |
| 7. Hand-held vibration instruments. Examples of hand-held vibration meters are the Columbia Research Laboratories’ VM-300 general purpose instrument that measures acceleration, velocity, and displacement (left) and Ludeca’s VIBXPERT II portable route-based vibration data collector, which is capable of vibration spectrum analysis and display on a VGA screen (right). Courtesy: Columbia Research Laboratory, Ludeca |
Another application for spot-checking is as an acceptance test to verify that a machine repair has been done properly. This analysis can verify proper bearing or gear installation and alignment or balancing to the required tolerances.
Additional information can be obtained by monitoring machinery on a periodic basis—for example, once a month or once a quarter. Periodic analysis and trending can provide a more subtle indication of bearing or gear wear, allowing personnel to project machine condition into the foreseeable future. This advance notice means that equipment can be repaired during normal machine shutdowns rather than after a machine failure has caused unscheduled downtime.
Though the costs have been reduced and the ease of use improved significantly over the past five years, vibration analysis is still one of the more complex and expensive predictive techniques. The complexity stems in large part from the relatively subjective nature of interpreting vibration spectra and the difficulty in setting effective alarm limits for a wide variety of rotating-machinery configurations. The relatively high cost per measurement point is a result of the need for sophisticated electronic instruments to collect, analyze, and store the data; the cost of personnel to collect the data; and the cost of personnel and training to interpret the data.
For those companies that are willing to make a commitment of manpower and resources, the payback can be considerable. Some companies report being able to accurately identify specific gears within a gearbox that are failing, substantially reducing the amount of downtime required for troubleshooting and repair. Others have been able to identify and solve complex resonance problems that were causing damage to shafts, bearings, and couplings.
In spite of the higher cost and complexity, the investment in vibration analysis equipment and manpower is often paid back within the first 18 months to two years. And, for companies with limited budgets, there are a variety of service companies that will perform vibration analysis on a contract basis.
More Coming
In the next segment of “Predictive Maintenance That Works,” we’ll continue our discussion of specific nondestructive testing–related condition-monitoring techniques used at power plants and why each should be a part of your PdM program.
—Dr. Robert Peltier, PE is POWER’s editor-in-chief.