Editor’s note: In this second installment of our Power 101 series (the first installment was Flue Gas Heat Recovery in Power Plants, published in three parts: Part I, Part II, and Part III), we examine boiler auxiliary components that may be secondary to the design of the boiler itself but which are absolutely essential to its operation. We begin this multi-part series with an introduction to the air preheater (APH) performance calculations. In Part II, we’ll examine performance degradation caused by corrosion and fouling as a result of coal combustion flue gas constituents plus the effects of ammonia and sodium bisulfite injection for SO3 mitigation. In Part III, we’ll look at options for improving APH performance. Future articles will center on improving the performance of other boiler auxiliaries.
The Ljungstrom (or Rothemuhle) air preheater (APH) transfers sensible heat in the flue gas leaving the boiler to the combustion air, using regenerative heat transfer surfaces in a rotating (Ljungstrom) APH or stationary (Rothemuhle) heat transfer matrix. Increasing the temperature of the incoming combustion air increases boiler efficiency and reduces the plant heat rate (Figure 1). The increase in boiler efficiency is significant: a 25F change in flue gas temperature leaving the APH results in an approximately 1% (relative) change in net unit heat rate, with a corresponding reduction in CO2 emissions.
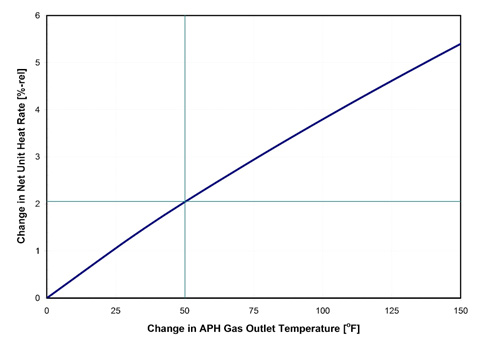
1. The effect of APH gas outlet temperature on net unit heat rate. Source: Energy Research Center, Lehigh University (ERC)
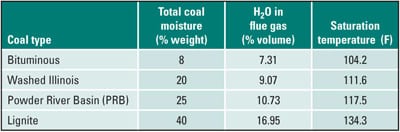
The flue gas temperature leaving the economizer (and entering the APH) is typically reduced from 600F to 800F to 275F to 350F at the APH outlet. Combustion air is heated from about 80F to 500F to 750F, depending on the coal heat and moisture content. In theory, only the primary air (the air used to dry the coal in the pulverizers and convey the pulverized coal to the burners) could be heated. Fuel can be combusted without preheating secondary and tertiary air. However, there is considerable advantage to the furnace heat transfer process by heating all of the combustion air: It increases the rate of burning and helps increase furnace flame temperatures.
The Ljungstrom APH operates by continuously revolving the heat transfer matrix through the gas (absorbing heat energy) and air streams (releasing heat energy) with a rotational speed in the 1 rpm to 3 rpm range. The Rothemuhle (or stationary plate) APH uses a stationary heat transfer matrix with a rotating air/flue gas hood (Figure 2).
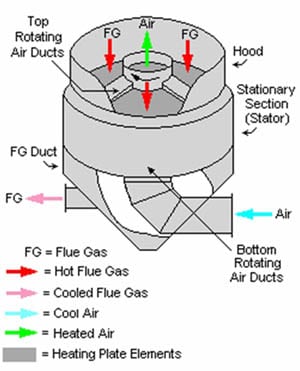
2. The Rothemuhle regenerative APH. Source: ERC
APHs can be designed as bi-sector or tri-sector types. In a bi-sector APH, total combustion air (secondary and primary air) flows through the air sector of the APH (Figure 3a). In a tri-sector design, the primary air flows through a separate primary air sector, while the secondary air flows through the secondary air sector (Figure 3b). A tri-sector design is used for boilers firing high-moisture or low-rank fuels where hotter primary air is needed for evaporation of coal moisture in mills.
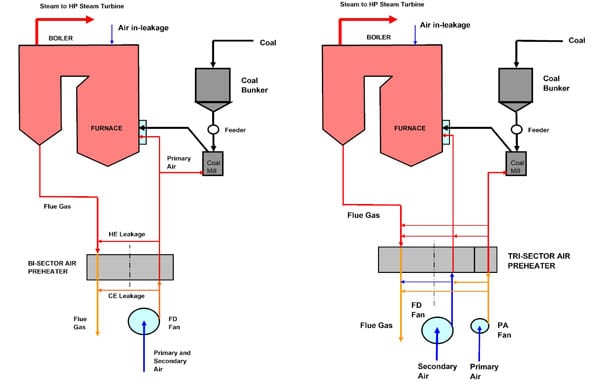
3. Bi-sector (left) and tri-sector (right) APH configurations. Source: ERC
Due to a difference in static pressure between the flue gas and combustion air streams, combustion air can leak into the flue gas stream. The APH leakage (δAPH,L) is typically in the 8% to 12% (by weight) range for Ljungstrom APHs. For the Rothemuhle APH, air leakages in the 25% to 30% range are not uncommon.
Leakage paths for a tri-sector APH are more complex, compared to a bi-sector APH. In a tri-sector APH, primary air (PA) leaks into the flue gas and secondary air (SA) streams, while SA leaks into the flue gas stream. Leakage occurs both on the cold end (CE) and hot end (HE) sides of the APH. Due to large difference in pressure between the PA and SA streams, as well as the PA and flue gas streams, leakage in a tri-sector APH is higher than in a bi-sector APH. It’s also important to note that for a tri-sector APH, the APH leakage, as defined by Equation 1 (all of the performance calculation equations referenced are included in an Appendix at the end of this article), does not include the PA to SA leakage and therefore is not an accurate measure of total air leakage. Furthermore, the PA to SA leakage cannot be measured either by the oxygen rise or tracer gas techniques but has to be calculated using information on pressure difference between the PA and SA streams and assumed clearances.
Air leakage for a tri-sector APH can be determined by a computer model, such as that presented in Figure 4. For this 700-MW power plant firing bituminous coal, leakages are calculated by using information on static pressure differences between the PA, SA, and flue gas streams, assuming two-thirds of the leakage occurs at the hot end of the APH. The air to flue gas leakage is 12% (by weight). As discussed earlier, this leakage does not include the PA to SA leakage. For the given static pressure distribution around the APH, a calculated value of the PA to SA leakage is 5.5%.
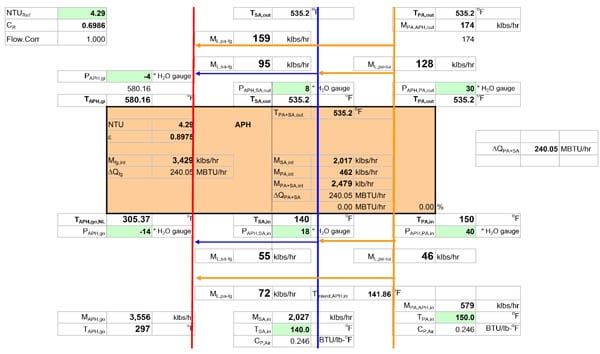
4. The Engineering Research Center at Lehigh University has written a computer model to calculate air and gas leakage for a tri-sector APH. Source: ERC
Air leakage also affects the flow rate of PA, SA, and flue gas through the APH heat transfer matrix and, thus, affects the APH capacity rate ratio (CR, known in the industry as the X ratio). This parameter has a significant effect on APH performance. The CE leakage affects the temperature of the flue gas leaving the APH. The flue gas temperature, downstream of the APH, after adiabatic mixing between the flue gas and air leakage streams (297F in this example), is lower compared to the flue gas temperature measured at the APH outlet (305.4F in this example).
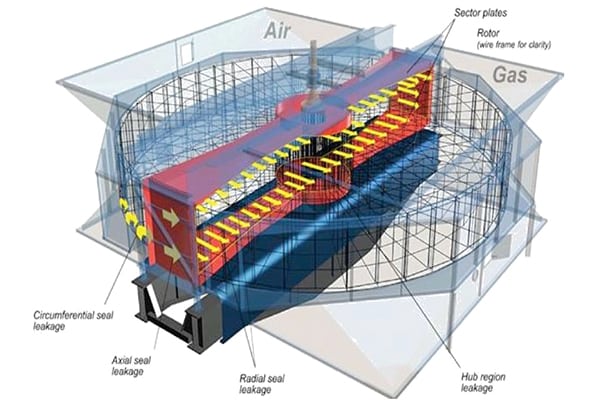
Major components of a vertical-shaft bi-sector Ljungstrom APH and leakage paths are presented in Figure 5. In this arrangement, the flue gas flows downward, while combustion air is flowing upward. The rotor, packed with heat transfer surface, is supported through a lower bearing at the CE of the APH and guided through a guide-bearing assembly located at the top or HE of the APH.

5. This illustration of a bi-sector Ljungstrom APH includes seals and leakage paths. Source: ERC
The conventional rotor sealing system contains of leaf-type labyrinth seals bolted to the rotor radial members at the HE and CE. The radial seals press against radial plates, located at the HE and CE. Axial seals are positioned along the periphery of the rotor. For the vertical-shaft Ljungstrom, where the rotor is supported from below, most of the leakage occurs at the HE of the APH. As a rule of thumb, approximately two-thirds of the air leakage occurs at the HE of the APH (Figure 5). For a horizontal-shaft APH, approximately two-thirds of air leakage occurs at the CE.
The transfer of heat from the hotter flue gas stream to the colder air stream creates temperature gradients, which cause thermal distortions throughout the structural members. The relative distortion of the various components affects clearances between the seals and sealing surfaces. Therefore, control of APH leakage is not an easy task, especially in case of a Rothemuhle APH.
The heat transfer surface of Ljungstrom- or Rothemuhle-type air preheaters uses a combination of flat or formed steel sheets with corrugated, notched, or undulated ribbing, forming longitudinal (axial) passages within the APH (Figure 6). The heat transfer surfaces are designed for high heat transfer and low pressure drop. As an approximate rule, 1 inch in height of standard Ljungstrom heat transfer surface recovers as much heat as 2 feet of surface in a tubular heater with equivalent resistance to flow. The compact arrangement of metal sheets permits a large amount of heat transfer surface to be placed in a relatively small rotor. Normally, the heat transfer surface is divided into two or more axial layers. Advantages resulting from layering the surface include these:
- A field-removable CE section, usually 12 inches in length (or height), that can be easily replaced in case of corrosion damage or severe plugging.
- Different heat transfer surfaces can be used in different layers to satisfy site-specific requirements. In addition, different-gauge materials can be used in each layer, with the CE layer typically manufactured of the heaviest gauge material.
- Each layer can be constructed of a different material to accommodate fouling and corrosion conditions that vary with flue gas temperature.

6. Fl at, notched, corrugated, and undulated steel plates are used to form APH heat transfer surfaces (top). The shape shown on the bottom left is typically used in the cold end layer of the APH. The bottom right configuration is traditionally used in the intermediate and hot end layers. Source: ERC
Estimating APH Air Leakage
The effect of APH air leakage on net unit heat rate and station service power is presented in Figure 7 for a bi-sector APH and a 400-MW power plant firing bituminous coal. The inlet guide vane flow control was assumed for FD and ID fans in this example.

7. The effect of APH air leakage on net unit heat rate and station service loads. Source: ERC
Changes in net unit heat rate and station service power can be developed as functions of the APH air leakage. The 6% APH leakage is used as a reference point, because it represents the design value used by APH manufacturers. As APH leakage increases, the net unit heat rate penalty increases linearly. A 10 percentage point increase in APH leakage (for example, an increase from 6% to 16%) increases station service power by about 11% and increases the net unit heat rate by approximately 0.25%. Eliminating APH leakage by using gas-to-gas heat exchangers or heat pipe heat exchangers will improve net unit heat rate by approximately 0.15%.
The heat rate penalty due to the APH air leakage is higher for tri-sector APHs, where high-pressure PA from the primary air sector leaks into the SA and flue gas streams, resulting in increased PA fan power requirements, in addition to increased FD and ID fan power. A comparison of the heat rate penalty for power plants employing bi-sector and tri-sector APHs is presented in Figure 8.

8. The effect on plant heat rate caused by APH air leakage for bi-sector and tri-sector APHs. Source: ERC
Besides affecting station service power and net unit heat rate, APH air leakage has a negative effect on performance of the air pollution equipment by reducing treatment (residence) time due to a higher flow rate of flue gas. Also, air leakage—including the APH and boiler in-leakage—has a negative effect on the post-combustion CO2 capture system and its efficiency. The size (and cost) of the post-combustion CO2 capture system is directly proportional to the flow rate of the flue gas that needs to be treated. In addition, efficiency of the post-combustion CO2 capture system is affected by the concentration of CO2 in the flue gas, which decreases as air leakage increases.
The effects of APH air leakage on the flue gas flow rate and CO2 concentration in the flue gas are presented in Figures 9 and 10 for a bi-sector APH installed on a typical 400-MW power plant firing bituminous coal. The flow rate of flue gas leaving the APH increases linearly as the APH air leakage increases. For high levels of APH leakage, typical of Rothemuhle APHs, the increase in flue gas flow rate is significant. In this situation, the concentration of CO2 in the flue gas decreases with air leakage. For high levels of APH leakage, the decrease in the CO2 concentration is significant.

9. The effect on flue gas flow caused by changes in APH air leakage. Source: ERC

10. CO2 concentration in the boiler flue gas decreases as APH air leakage increases. Source: ERC
In the case of an oxy-combustion retrofit, any air leakage will have a severe negative effect on plant efficiency, retrofit cost, and CO2 purity and will have to be eliminated. This will require zero-leakage heat exchangers when firing in the oxy-fuel mode.
Air Preheater Seals

11. The APH air leakage will drift up quickly after installation. Source: "Modernization of Rotating Matrix Regenerative Air Preheaters," Howden Power Ltd., presented at PowerGen 1996.
In addition to higher FD and ID power requirements and higher net unit heat rate, the deterioration in leakage performance can have other serious consequences. These changes include reduced downstream temperatures (because of the dilution effect), causing a potential for increased acid deposition and corrosion of the downstream ductwork and increase in the FGD booster fan power. In severe cases, derating the unit might be required due to fan limitations.
Adjustable Sector Plate. Manually adjustable sector plates are used to minimize APH leakage, as APH seals wear over time. An improved version of this concept involves actuator-adjusted radial and axial sealing plates (Figure 12). Sliding arrangement of the top and bottom radial sector plate primary seals allows movement of the sealing surfaces. These seals are prone to wear and erosion by fly ash in the flue gas stream. Although initially these seals showed good sealing characteristics, after years of operation, seal wear contributed to air leakage around the sector plates. As a direct consequence of the leakage, deposition of fly ash behind the sector plates caused reduced sector plate travel that caused the plates to jam in position. Similar problems occur on the axial seal plates. The best way to solve the problem is complete removal of the adjustment to the sealing surfaces. During the APH retrofit, the sector and axial sealing plates are set to accommodate all clearance gaps for all operational duties and are welded in position, eliminating the need for future adjustment or maintenance.

12. Adjustable seal plate design. Source: ERC
Radial and Axial Seals. Radial seals are used to minimize the direct air to gas leakage that occurs at the center section or sealing surfaces in the APH. The seals are attached to each diaphragm (stay, splitter, or radial division plate) of the rotor to maintain close contact with the sealing surface (that separates the air and gas streams) and to axial seal holding bars. Single-leaf sealing strips, fitted to the radial division plates and axial seal holding bars, provide a sharp edge that allows fine adjustment for proper seal setting.
Early experiences showed that two-leaf type seals showed better initial sealing characteristics with adjustable mechanisms (adjustable sector plate), but because of this adjustment they were prone to wear. Laboratory tests found that once worn, two-leaf seals were no longer any better than an equivalent single-leaf seal. With the modifications to fixing adjustable sealing surfaces, the single-leaf seal was found to be more effective.
There are many designs of single-leaf seals. For example, radial seals offered by Paragon Airheater Technologies are designed to act like a spring and maintain a positive contact between the seal and the sealing surface (Figure 13). The spring force prevents the seal from opening due to high differential pressure across the hot and cold ends of the APH. The bellows architecture enables the seal to "self-adjust" over time as wear occurs on the sealing edge, or during APH turndown. The seal replaces the OEM seals and attaches to each diaphragm, utilizing the existing holding hardware and the existing bolt holes on the diaphragms. The seals are installed and adjusted to maintain the appropriate force and clearance between the seal and sealing surface.
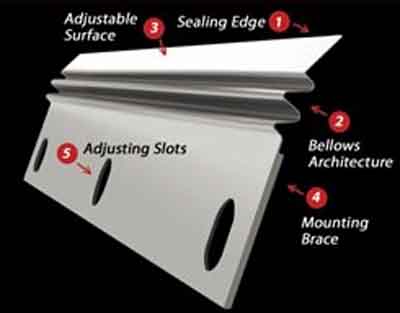
13. Single-leaf adjustable radial seal. Source: Paragon Airheater Technologies
Traditional APH designs have either 12-sector rotors with 30° sector plates or 24-sector rotors with 15° sector plates, which means that only one radial sealing strip is passing under the sector plate at a time. Damage, corrosion, and erosion of these seals dramatically increases the leakage. Theory shows that leakage is directly proportional to the square root of the driving pressure differential, so it follows that if the number of seals under the sector plate is doubled, effectively halving the pressure differential acting on each sealing surface, the radial leakage will be decreased by approximately 30%. The double-sealed APH rotor design is presented in Figure 14.

14. Double-sealed APH rotor design compared to the older single-sealed rotor design. Source: ERC
Circumferential and Bypass Seals. Circumferential seals prevent air and gas from bypassing the heating surface through the space between the rotor and the housing shell. These seals are retained by mounting angles bolted to the circumference of the rotor. Circumferential seals wear against the sealing rings, which are welded to the APH housing.
Bypass seals differ from circumferential seals by reducing the quantity of air flowing over the outer rim of the rotor, as the task of reducing axial leakage is handled by the axial sealing system. Bypass seals are mounted on the housing and seal against the rotor-mounted T-bar.
Circumferential and bypass seals are installed at the hot and cold ends of an APH (Figure 15). Bypass reduces APH performance because the air and flue gas bypassing the APH rotor are not participating in heat exchange. As a result, the temperature of combustion air leaving the APH is lower, while the temperature of the flue gas is higher, compared to the zero-bypass case.

15. Circumferential and bypass seals on an APH. Source: ERC
The circumferential and bypass seals offered by Paragon Airheater Technologies are composed of two interlocking members (Figure 16). The tabs and slots interlock, providing seal tabs from being torn lose in the event that the APH rotor comes in contact with the seal or a foreign object, such as a clinker lodged between the rotor and the seal (Figure 17). The neck (narrow) sections of the seal do not overlap, providing greater flexibility for each of the tabs. With standard circumferential and bypass seal designs, it is very common for seal tabs to be torn away, thus exposing large gaps that provide leakage paths around the APH rotor.
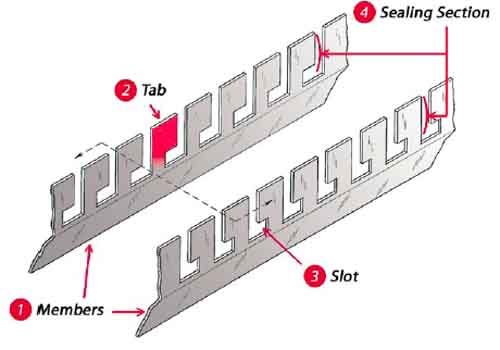
16. Interlocking design of circumferential and bypass seals. Source: Paragon Airheater Technologies
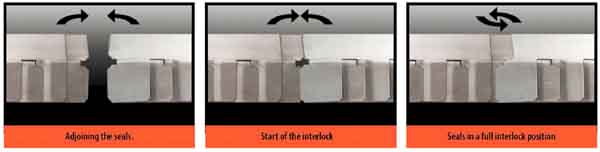
17. Interlocking process of sealing members. Source: Paragon Airheater Technologies
The use of advanced and self-adjusting seals can reduce APH leakage by a factor of two, resulting in fan power reduction, net power output increase, and reduction in operating costs. However, even with advanced seal designs, APH leakage should be checked on an annual basis. Seals need to be adjusted or replaced to keep APH air leakage and air and flue gas bypass low. The oxygen rise method is commonly used for determining air leakage. The tracer gas techniques are accurate, but very expensive.
It should be noted that internal bypass of combustion air and flue gas can also occur as a consequence of excessive clearances between individual APH baskets. This situation might occur after an APH basket replacement if new baskets are slightly undersized (Figure 18). A careful inspection of APH basket size is very important. Equally important is detailed inspection of the re-basketed APH to ensure there are no gaps or clearances between the baskets.

18. The location of internal bypass through clearances between APH baskets is shown by the arrows. Source: ERC
The Effect of Boiler Leakage on APH Performance. As the air in-leakage in a boiler convective pass increases, the value of excess O2 measured in the economizer gas exit duct increases. This increase is sensed by the combustion control system and interpreted as an increase in airflow rate. To maintain the O2 setpoint, the combustion control system reduces the flow rate of combustion air. A lower flow rate of combustion air results in a lower furnace excess air (excess O2) level, increased CO emissions, increased levels of unburned fuel in fly ash, higher furnace exit gas temperature, increased slagging and fouling rates, and higher net unit heat rate.
To illustrate the effect of boiler convention pass leakage on APH and unit performance, calculations were performed for a bituminous coal-firing 400-MW unit configured with a bi-sector APH. The excess O2 setpoint of 3.5% was maintained at the economizer gas exit. The results are presented in Figures 19 to 22.
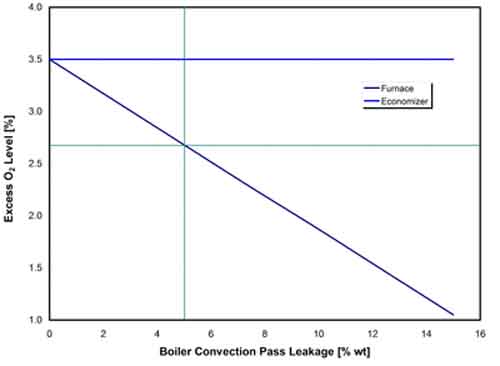
19. The effect of boiler convection pass leakage on excess oxygen levels in the flue gas. Source: ERC

20. Boiler convection pass leakage will change the air and flue gas flow rates. Source: ERC

21. APH capacity rate ratio as a function of boiler convection pass leakage. Source: ERC
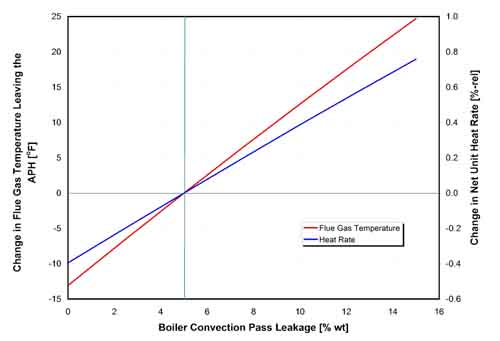
22. The change in flue gas temperature at the APH outlet and net unit heat rate as a function of boiler convection pass leakage. Source: ERC
The furnace excess O2 level decreases linearly with boiler convention pass leakage, as the excess O2 setpoint is maintained at the economizer gas outlet. As the boiler convection pass leakage doubles from the reference value of 5%, the furnace excess O2 decreases from 2.7% to 1.9% (Figure 19). Corresponding changes in combustion air and flue gas flow rate are presented in Figure 20. An increase in boiler convection pass leakage from the reference value of 5% to 10% results in about a 4.4% decrease in airflow. The flue gas flow rate increases slightly because of the higher unit heat rate.
These changes in air and flue gas flow rates result in a change in the APH capacity rate ratio, CR, which decreases as boiler convection pass leakage is increased (Figure 21). The capacity rate ratio has a large effect on thermal performance (effectiveness, ε) of an APH and represents the ratio of capacity rates (product of specific heat and mass flow rate) of air to flue gas streams. A lower CR value, therefore, corresponds to a lower flow rate of air through the APH and higher temperature of flue gas leaving the APH. Higher flue gas exit temperature, in turn, results in higher unit heat rate.
Changes in flue gas temperature at the APH exit and net unit heat rate are presented in Figure 22 as functions of the boiler convection pass leakage. Both increase linearly with the increase in air leakage. The net unit heat rate increases by 0.4 percentage point as the boiler convection pass leakage increases from 5% to 10%. For best unit performance, it is important to maintain boiler tightness and keep convection pass leakage at a minimum.
It is recommended that annual checks of boiler tightness be performed. The convection pass leakage is determined by measuring excess O2 level at the furnace and economizer exit planes. A traverse is needed at both locations to account for spatial stratifications. A water-cooled high-velocity thermocouple (HVT) probe is used for excess O2 measurement at the furnace exit plane. The alternative includes temperature mapping by a permanently installed multi-grid acoustic or tunable laser measurement system. Unfortunately, very few plants are equipped with such systems, so manual HVT traverses are needed.
APH Corrosion and Fouling
Depending on the coal’s mineral content, these deposits can be removed easily (as is the case for bituminous coals). On the other hand, western coals and lignites have a high alkaline content, causing calcium and magnesium oxides from the fly ash to sulfate on the APH furnace, forming hard-to-remove deposits. Other APH fouling mechanisms include deposition of the ammonium bisulfate, injected additives, nitric acid, and ammonium nitrate. The latter could be a consequence of ammine-enhanced fuel-lean gas reburn. The effect of fouling of CE passages in two APHs is presented in Figure 23.
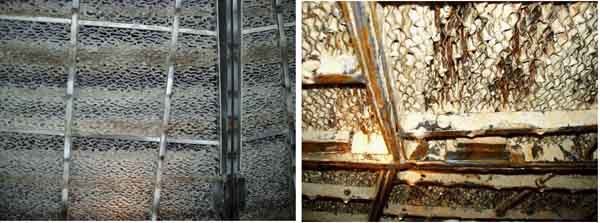
23. Examples of fouled APH cold end passages. Source: ERC
In case the deposits cannot be removed by the APH sootblowers, APH water washes are needed to restore the APH pressure drop (Figure 24). Scheduled and unscheduled outages for APH water washing reduce unit availability.
The full-load operating data for a 650-MW unit (Figure 24) show that as a consequence of CE plugging, the secondary APH gas-side pressure drop doubled: It increased from about 7 inches to 14 inch w.g. in less than one year.

24. Variations of the gas-side pressure drop for the primary and secondary APHs are illustrated for a 650-MW coal-fired plant. The primary APHs are not water-washed because they operate with higher exit flue gas temperature compared to the secondary APHs. Owing to the higher exit temperature, the light deposition on the primary APH has caused a gas-side pressure drop increase of 2 inches to 3 inches w.g. over a five-year period. Source: ERC
If severe plugging occurs, the unit might become fan-limited, causing a unit load derate until the APH is washed and the APH pressure drop is restored. In case of high-alkali coals that produce hard-to-remove deposits, the APH pressure drop might not be fully restored by the water wash and, after a few years of operation, APH baskets need to be replaced.
Figure 25 shows variation in the APH gas-side pressure drop as a function of cumulative generation (MWh). Cumulative generation is a better parameter to use than elapsed time, because the unit load profile varies with time. The results show that due to high gas-side APH pressure drop (in excess of 12 inches w.g.) the heat transfer baskets had to be replaced. With new baskets, the pressure drop was cut in half. However, as hard-to-remove deposits continued to develop, the pressure drop increased, requiring a water wash. Although the APH pressure drop was reduced, it was not restored. Predictably, after several APH water-wash cycles, the APH pressure drop will increase to a point where basket replacement will be necessary. Aggressive water washing might cause erosion and warping of CE baskets, which reduces basket life, increases APH pressure drop, and might cause pressure oscillations in the boiler.

25. Water washing the APH can restore pressure drop lost by contaminates. The blue line represents the APH pressure drop before a water wash; the red line is APH pressure drop after a water wash. Source: ERC
Corrosion of APH heat transfer surfaces results in reduced heat transfer and reduced basket life. Corrosion of the CE baskets is presented in Figure 26. The loss of heat transfer surface reduces performance of the APH because of the higher temperature of flue gas at the APH exit. Sample calculations for the APH suffering from severe corrosion of CE baskets are presented in Figure 27. The original length of the CE layer is 12 inches. As heat transfer surface is lost due to corrosion, the length of the CE layer decreases. A 50% loss of heat transfer surface, therefore, corresponds to the CE layer length of 6 inches. For this APR, this loss of surface area produces a heat rate penalty of about 17 Btu/kWh.
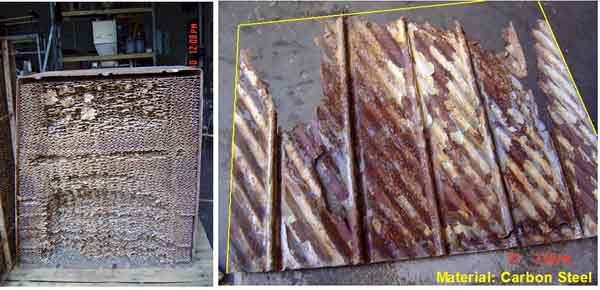
26. Corrosion of APH cold end baskets. Source: ERC

27. The effect of lost heat transfer surface due to corrosion on APH performance. For this APH, the entering gas was at 600F and the entering air was at 89F. Source: ERC
APH Thermal Performance
Thermal effectiveness, calculated by Equation 8 (found in the Appendix) is presented as a function of number of transfer units, NTUo, for CR values in the 0.60 to 0.95 range (Figure 28). The thermal effectiveness of an APH increases as the size of the APH increases (as NTUo increases) and CR ratio (the flow rate of combustion air relative to flue gas) increases. Actual APH performance (denoted as Test Data in Figure 28), determined from APH performance tests, is compared to design performance (denoted as Design).

28. A typical APH performance diagram showing design and test conditions. Source: ERC
APH Correction Factors
- Inlet air remperature
- Inlet gas temperature
- Capacity rate ratio
- Flue gas flow rate
Air Preheater Performance Case Study

29. Test (measured) values of air temperature at the APH inlet. Source: ERC

30. Test (measured) values of flue gas temperature at APH inlet. Source: ERC
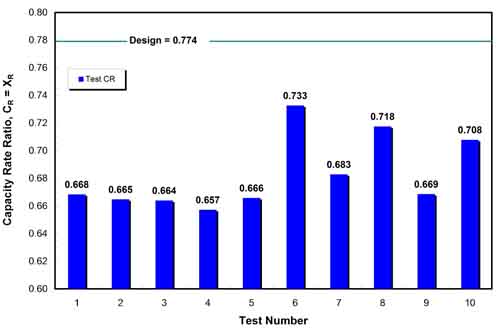
31. Calculated values of the capacity rate ratio. Source: ERC
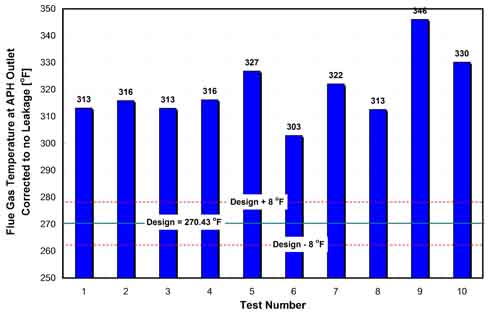
32. Calculated values of flue gas temperature at the APH outlet corrected to no leakage. Source: ERC
The values of thermal effectiveness found from Equation 3 and dimensionless heat transfer size of the APH (NTUo), calculated from Equation 11, are presented in Figure 28.
Corrections to Tgo,NL, calculated according to ASME PTC 4.3, are presented in Figure 33. The results show that the correction due to CR deviation constituted the largest part of the total correction. The corrected values of Tgo,NL, presented in Figure 34, were much closer to the design values, compared with the uncorrected values. The APH thermal performance map (Figure 35) shows corrected values of ε aligned along the CR = CR,Design line. The results show that in this case the new APH design did not meet performance guarantees because ε and NTUo were below the manufacturer’s guarantee, even when accounting for the manufacturer’s tolerance. The internal air and flue gas bypass was the main reason for reduced APH performance.
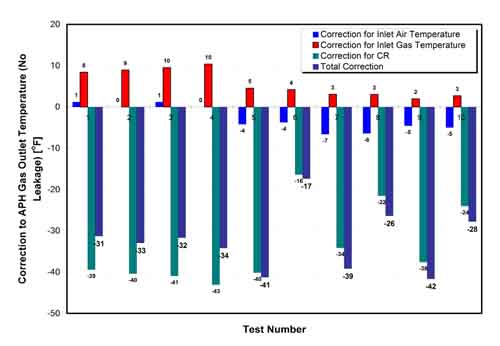
33. APH corrections calculated according to ASME PTC 4.3. Source: ERC

34. Test and corrected values of flue gas temperature at the APH outlet. Source: ERC

35. Complete performance diagram of the APH. Test data was corrected according to ASME PTC 4.3. Source: ERC
APH Modeling: The MTC Code
MTC is a final-difference code that predicts thermal performance of the APH (ε and NTUo) as well as temperatures of heat transfer surfaces and of combustion air and flue gas within the APH heat transfer matrix. The code has been verified against field data and can be used for modeling of Ljungstrom- or Rothemuhle-types of APHs. The code allows determination of the effect of plant operating parameters (temperatures and flow rates of combustion air and flue gas trough the APH), APH operating parameters (air leakage and rotational speed), and APH design parameters (length and number of axial layers and heat transfer surface type) on thermal performance and metal and fluid temperatures. The MTC code is an indispensable tool used to solve problems associated with APH performance, fouling, and corrosion.
The metal and fluid temperatures within the APH heat transfer matrix, predicted by the MTC code for specific APH geometry and operating conditions, are presented in Figures 36 and 37. As the APH metal matrix rotates through the flue gas duct (or, in case of the Rothemuhle-type APH, as the flue gas hood is passing over the fixed heat transfer matrix), the temperature of the matrix, Tm, increases from the minimum to maximum value (Figure 36). The minimum value occurs as the matrix enters the flue gas stream, while the maximum value is achieved as the matrix leaves the flue gas stream. During the air cycle, Tm decreases and reaches its minimum value as matrix is leaving the air stream. The heating and cooling cycle repeats as matrix is traveling though the gas and air cycles. The difference between the minimum and maximum values, ΔTm, is called the metal temperature swing.

36. Peripheral variation of the APH matrix temperature for a secondary APH at full load with new baskets at design operating conditions. Source: ERC
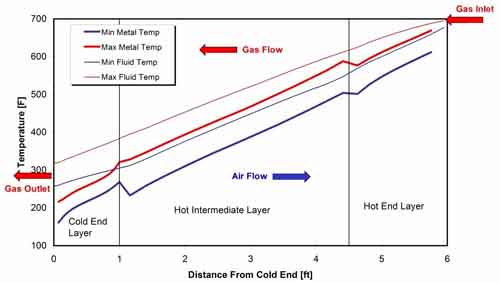
37. Axial variation of APH matrix temperature with new baskets as a function of distance from the cold end. Source: ERC
A family of the heating and cooling cycles (Figure 36) corresponds to different axial locations from the APH CE. At axial locations closer to the CE, metal temperatures are lower. The matrix temperature is lowest at the CE of the APH (0 feet from CE in Figure 36), in this example in the 150F to 200F range. The Tm value at the entrance of the CE layer (1 ft from CE in Figure 36) are higher and, in this example, range from 270F to 300F. Metal temperatures in the hot intermediate layer are even higher.
Axial variation of predicted matrix and fluid temperatures (flue gas and air) is presented in Figure 37 for the APH consisting of three axial layers: CE, hot intermediate, and HE. The minimum and maximum temperatures are presented. The values of Tm and Tfluid are the highest at the hot end (flue gas inlet) side of the APH. The matrix and flue gas temperatures decrease in direction of the flue gas flow and reach their minimum values at the CE (air inlet) side of the APH. Metal temperatures at the HE are primarily controlled by the inlet temperature of flue gas, while temperature of the inlet air has a predominant effect on Tm in the CE layer of the APH.
As a consequence of the matrix or hood rotation, the flue gas temperature leaving the APH increases, while the temperature of the combustion air leaving the APH decreases in the direction of the rotation, causing temperature stratifications in the outlet flue gas and air streams. Typical gas and air temperature stratifications are presented in Figure 38.
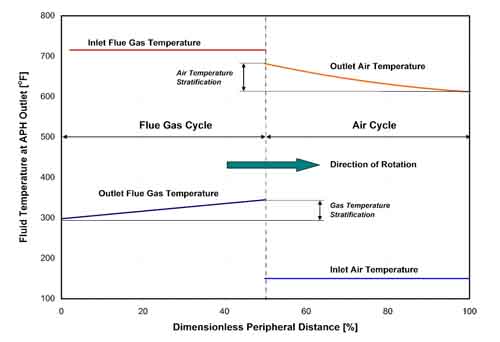
38. Temperature stratification at the APH exit. Source: ERC
Large temperature stratification in the flue gas stream leaving the APH can negatively affect performance of the electrostatic precipitator (ESP). This occurs because resistivity of the fly ash is affected by temperature. Temperature stratifications, measured in the exit ducts of two APHs operating in parallel and rotating in the clockwise direction, are clearly shown in Figure 39. The flue gas temperature is lower at the left side and higher at the right side of both ducts. As a consequence, the low-resistivity zones are set up at the left side of the ESP, while the high-resistivity zones are near the right wall of the ESP. This stratification of temperature and fly ash resistivity requires stratified injection of SO3 to maintain a relatively uniform fly ash resistivity across the ESP inlet duct.
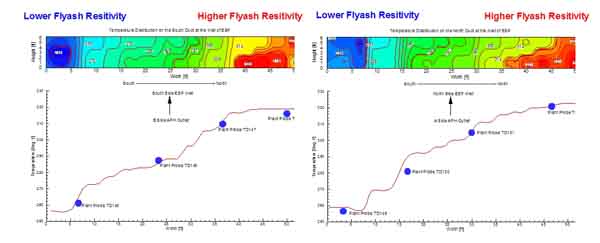
39. Measured temperature stratification in flue gas stream leaving the APH. Source: ERC
In order for heat transfer to occur between the flue gas and metal matrix, the temperature of the flue gas is above the metal temperature. Conversely, for the metal matrix to transfer heat to combustion air, the metal temperature must be higher than the air temperature. This temperature difference, especially between the flue gas and metal matrix, makes it difficult to monitor the potential for acid deposition in the CE layers of the APH. This is because only the average flue gas temperature leaving the APH is measured, and metal temperatures need to be inferred from measured values of the flue gas temperature.
The MTC code is used extensively to develop strategies for effective control of acid deposition in the CE layer of the APH and ammonium bisulfate deposition inside the HE layer of the APH. The results are used to evaluate tradeoffs between deposition potential and heat rate penalties associated with higher matrix and flue gas temperatures.
More to Come
—Nenad Sarunac is principal research engineer and associate director at the Energy Research Center, Lehigh University. The Illinois Clean Coal Institute funded a portion of this work.
Appendix
δAPH,L = MAir Leakage/Mfg,APH,in x 100% (Equation 1)
where:
MAir Leakage = Mass flow rate of combustion air leakage into the flue gas
Mfg,APH,in = Mass flow rate of flue gas upstream of the APH
Heat Exchanger Thermal Performance
According to the ε-NTU theory of heat exchangers, the thermal effectiveness (ε) of a typical power plant Ljungstrom air preheater can be expressed as a function of the NTU and CR of the heat exchanger:
ε = f{NTUo, CR} (Equation 2)
where:
ε, thermal effectiveness is defined as:
ε = (Tao – Tai)/(Tgi – Tai) (Equation 3)
or:
ε = (Tgi – Tgo,NL)/[CR(Tgi – Tai)] (Equation 4)
ηG = Gas-side efficiency
ηG = (Tgi – Tgo,NL)/(Tgi – Tai) = εCR (Equation 5)
Tgi = Measured inlet flue gas temperature
Tgo = Measured inlet flue gas temperature
Tai = Measured inlet air temperature
Tao = Measured outlet air temperature
Tgo,NL = Flue gas temperature at the APH outlet, corrected to the no-leakage condition is calculated according to the ASME PTC 4.3 code for air preheaters by assuming all leakage occurs at the APH cold end.
Tgo,NL = δL Cpa/Cpg (Tgo – Tai) + Tgo (Equation 6)
Cpa = Mean specific heat of air
Cpg = Mean specific heat of flue gas
NTUo = Dimensionless heat transfer size of the APH, defined as:
NTUo = UA/Cair (Equation 7)
U = Overall heat transfer coefficient
A = Total heat transfer area
CR = Capacity rate ratio, also known in the industry as the XR ratio, defined as:
CR = Cair/Cgas (Equation 8)
Cair = Capacity of the air stream flowing through the APH
Cgas = Capacity of the gas stream flowing through the APH
The relationship between ε, NTUo, and CR for a rotating regenerative heat exchanger can be approximated by the following equation:
ε = [1- exp(-NTUo(1-CR)]/[1-CR exp(-NTUo(1-CR)] (Equation 9)
Often, thermal performance of the APH is not known and has to be determined by performing the APH performance test. The procedure for determining ε and NTUo is as follows:
- Use measured inlet and outlet values of air and flue gas temperature Tai, Tao, Tgi, and Tgo, and APH air leakage (δL) to correct outlet flue gas temperature to the no-leakage condition, using Equation 6.
- Calculate capacity rate ratio using:
- Calculate thermal effectiveness, ε, using Equations 3 or 4.
- Calculate number of transfer units NTUo by inverting Equation 9. The resulting expression is:
Figure 28 illustrates a comparison of the calculated values of ε and NTUo to design or guaranteed values.
Correction Factors
Tgo,NL,corr for Tai = [Tai,des(Tgi – Tgo) + Tgi(Tgo – Tai)]/(Tgi – Tai) (Equation 12)
where:
Tgo,NL,corr for Tai = Flue gas temperature at the APH outlet corrected for no leakage and inlet air temperature deviation
Tai,des = Design value of air temperature at the APH inlet
Inlet Gas Temperature Correction. The value of Tgo,NL corrected for the deviation in the inlet gas temperature from the design value is, according to the ASME PTC 4.3 code, determined from:
Tgo,NL,corr for Tgi = [Tgi,des(Tgo – Tai) + Tai(Tgi – Tgo)]/(Tgi – Tai) (Equation 13)
where:
Tgo,NL,corr for Tgi = Flue gas temperature at the APH outlet corrected for no leakage and inlet gas temperature deviation
Tgi,des = Design value of inlet gas temperature
Equations 12 and 13 were developed by assuming a constant value of the gas side efficiency. Although the gas side efficiency does not remain constant as the inlet air or gas temperatures change, Equations 12 and 13 represent good approximations for small to moderate changes in inlet temperatures.
The inlet air and gas temperature corrections can, alternatively, be developed by using the ε-NTU theory (Equations 3 and 4) and design value of the APH effectiveness and capacity rate ratio. The resulting expressions, developed by the author of this article are:
Tgo,NL,Corr. for Tai = Tgi,des – CR,des εdes (Tgi,des – Tai,act) (Equation 14)
Tgo,NL,Corr. for Tgi = Tgi,act – CR,des εdes (Tgi,act – Tai,des) (Equation 15)
Equations 12 and 13 give virtually identical results to the results that come from Equations 14 and 15.
Capacity Rate Correction. According to the ASME PTC 4.3 code, the value of Tgo,NL corrected for the deviation in the capacity rate ratio from the design value is determined from:
Tgo,NL corrected for CR = Tgi(1-ηG)/Fx + Tai ηG /Fx (Equation 16)
where:
Tgo,NL corrected for CR = Flue gas temperature at the APH outlet corrected for no leakage and capacity rate ratio deviation
Fx = ASME correction factor for deviation of CR
As specified by the ASME code, correction factor Fx is determined from the appropriate design correction curve (usually supplied by the manufacturer), which can be verified by field tests, although such procedure is considered impractical. It has to be noted that the Fx curve and numerical value of Fx correction factor are not independent of the APH size, and APH-specific curves are, therefore, required. Correction factor Fx for an APH is presented in Figure A1 as a function of the capacity rate ratio.

A1. Capacity rate correction according to ASME PTC 4.3. Source: ASME
The alternative approach for performing correction for CR was developed by the author of this article. This approach enables a plant to develop its own correction curves and, therefore, not depend on the manufacturer’s corrections. The correction to flue gas temperature leaving the APH (for the no-leakage condition) is calculated as a function of deviation in capacity rate ratio, ΔCR, from design conditions. The corrections were determined by using the ε-NTU theory of heat exchangers, and the Metal Temperature Code (MTC) for rotating regenerative APHs.
The results, presented in Figure A2, show that a simple ε-NTU theory correction works well in cases where ΔCR variations do not significantly exceed ±0.05. For larger deviations in CR from its design value, the MTC code results should be used for better accuracy.
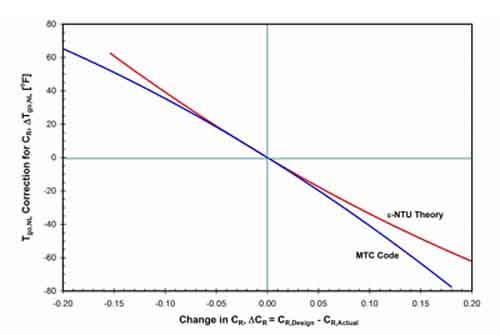
A2. Correction to Tgo,NL as a function of CR deviation from design value according to ε-NTU theory and the MTC computer code. Source: ERC
When using this alternative approach, the corrected value of Tgo,NL is determined from:
Tgo,NL corrected for CR = Tgo,NL + ΔTgo,NL (Equation 17)
Gas Flow Correction. According to the ASME PTC 4.3 code, the value of Tgo,NL corrected for the deviation in the flue gas flow rate from the design value is determined from:
Tgo,NL corrected for Mgas = Tgi(1-ηG)/FG + Tai ηG /FG (Equation 18)
where:
Tgo,NL corrected for Mg = Flue gas temperature at the APH outlet corrected for no leakage and flue gas flow rate deviation.
FG = ASME correction factor for deviation in flue gas flow rate from the design value.
The correction for flue gas flow rate is usually very small.