The current sluggish U.S. economy is now being reflected in the country’s overall production of electricity. On Nov. 13, the Energy Information Administration (EIA) released a report that concludes net generation of electricity in the U.S. was down for the 13th consecutive month compared to the same calendar month in the prior year.
The EIA’s November issue of Electric Power Monthly states that net generation in the U.S. dropped by 1.9% from August 2008 to August 2009.
The U.S. Commerce Department reported that real gross domestic product decreased 0.7% from the first quarter of 2009 to the second quarter of 2009. Continuing to mirror this decline, industrial production in August 2009, as reported by the Federal Reserve, was 10.7% lower than it had been in August 2008. It was the 14th consecutive month that same-month industrial production was lower than it had been in the previous year. The National Oceanic and Atmospheric Administration’s population-weighted Residential Energy Demand Temperature Index for August 2009 was actually 1.7% “above average,” whereas the August 2008 value was “3.5% below average consumption.”
Greatest Drop in Coal-Fired Generation
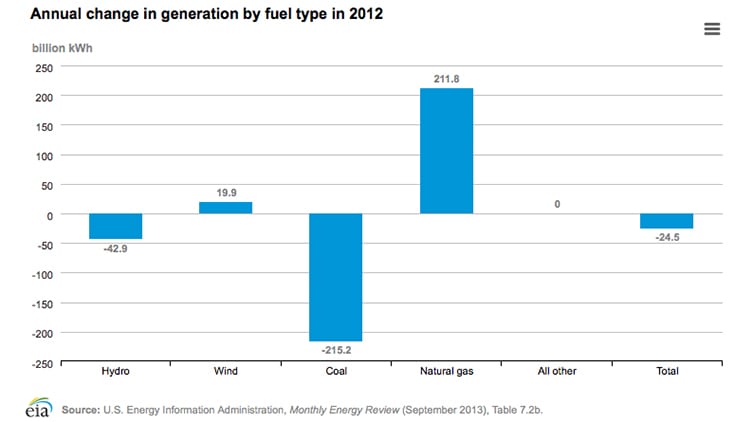
The drop in coal-fired generation was the largest absolute fuel-specific decline from August 2008 to August 2009; it fell by 17,133 GWh, or 9.4%. Declines in West Virginia, Tennessee, Indiana, Alabama, Florida, Illinois, Wisconsin, and Ohio accounted for 53.1% of the national decrease in coal-fired generation. The August decline was the eighth consecutive month of relatively large drops in coal-fired generation from the same month in the prior year, though it was not as precipitous as the drop of 15.3% in March or the decline of 15.1% in February. Generation from natural gas–fired plants was 9.3% higher than it was in August 2008.
Gas-Fired and Wind Generation Rises
Gas-fired generation was the largest absolute fuel-specific increase between August 2008 and August 2009. Increases in Pennsylvania, Florida, Alabama, New York, Massachusetts, Virginia, and Arkansas accounted for 58.3% of the national increase in gas-fired generation. The second-largest absolute fuel-specific increase—and largest percentage increase—was wind generation, which was up by 60.7% over August 2008 totals. The jumps in wind generation in Texas and Iowa accounted for 56.5% of the national rise in wind generation.
Declines in Hydro and Petroleum Liquid Generation
Generation from conventional hydroelectric sources was down by 3.9% from August 2008 to August 2009. Nuclear generation was down 0.5%. Petroleum liquid–fired generation was down by 2.0% compared to a year ago, and its overall share of net generation continued to be quite small compared to coal, nuclear, natural gas–fired, and hydroelectric sources.
2009 Net Generation Profile
Year-to-date, total net generation was down 4.9% from 2008 levels. Net generation attributable to coal-fired plants was down 12.6%. Nuclear generation was up by 0.7%. Generation from petroleum liquids was down by 7.8%, while natural gas–fired generation was up by 2.9% year-to-date. The year-to-date wind generation total was up 27.0%.
In 2009 from January through August, coal-fired plants contributed 44.4% of U.S. electric power. Nuclear plants contributed 20.4%, while 23.2% was generated at natural gas–fired plants. Of the 1.1% generated by petroleum-fired plants, petroleum liquids represented 0.7%, with the remainder from petroleum coke. Conventional hydroelectric power provided 7.1% of the total, while other renewables (biomass, geothermal, solar, and wind) and other miscellaneous energy sources generated the remaining 3.6% of electric power.
Consumption of coal for power generation in August 2009 was down by 9.1% compared to August 2008. For the same time period, consumption of petroleum liquids was up fractionally, while petroleum coke fell by 7.1%. Consumption of natural gas increased by 9.9%.
EIA’s next monthly issue of Electric Power Monthly will be released in mid-December.
Source: EIA