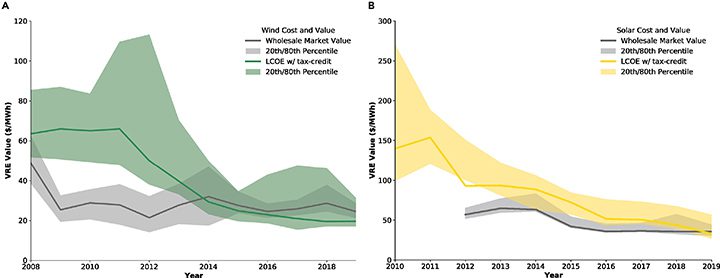
The costs for wind and solar power generating systems have decreased dramatically over the past decade. According to the International Renewable Energy Agency (IRENA), the global weighted-average levelized cost of electricity for newly commissioned utility-scale solar photovoltaic (PV) projects fell by 85% between 2010 and 2020, from $0.381/kWh to $0.057/kWh. Over the same period, costs for onshore wind projects declined by 56%, from $0.089/kWh to $0.039/kWh.
“The last decade has seen [concentrating solar power], offshore wind and utility-scale solar PV all join onshore wind in the cost range for new capacity fired by fossil fuels, when calculated without the benefit of financial support. Indeed, the trend is not only one of renewables competing with fossil fuels, but significantly undercutting them,” Francesco La Camera, director-general of IRENA, wrote in the group’s June 22-released report Renewable Power Generation Costs in 2020.
Not surprisingly, as costs decreased, the installed capacity of solar and wind power have increased. IRENA reports the global cumulative installed capacity of all solar PV (utility-scale and rooftop) increased from 42 GW in 2010 to 714 GW in 2020. The cumulative installed capacity of onshore wind grew from 178 GW to 699 GW during the period.
Power Market Prices Affected
In the U.S., the growth of wind and solar has caused some interesting market dynamics to take shape. In regions where solar and wind make up a large share of power generation, sunny and windy days lead to a glut of electricity supply, driving down hourly power prices, greatly affecting the value of the solar and wind generation. That causes a serious problem for project developers, who need positive economic forecasts to get new solar and wind farms built.
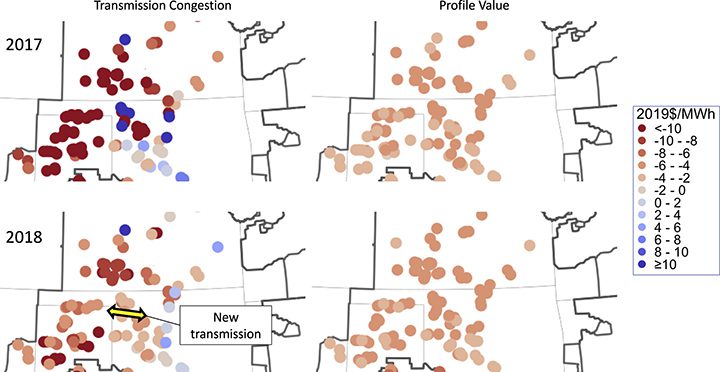
Researchers at Lawrence Berkeley National Laboratory (LBNL), led by research scientist Dev Millstein, conducted a study to better understand the potential implications of the problem. They looked at how the value of energy and capacity in major regional U.S. power markets changed over time at 2,100 utility-scale power plants across the country, using data through 2019. They specifically reviewed three drivers of market value: output profiles, transmission congestion, and curtailment. Their findings were published on June 21 in the energy research journal Joule. Ben Paulos, a friend of mine at LBNL, brought the study to my attention and suggested I contact Millstein to learn more about it.
Millstein explained that the team compared the market value of wind and solar in various regions and years against the market value of a “flat block” of generation, which represented a theoretical “always-on” power plant. The market value of flat-block generation was calculated across locations in each region.
Among the notable discoveries was that solar installations tended to have relatively high market values at penetration levels less than 3%, but market value decreased as penetration increased. Wind market value was less than a flat block even at low penetration, but it declined only modestly with penetration.
“We already expected that, as deployment of wind and solar increased, the grid-system value of wind or solar would decline relative to the average value of generation from all sources. The key question was: would grid-system value decline faster than costs?” Millstein recounted. “The good news is that we found that average costs declined faster than average grid-system value, through 2019 (the end of our study period data).”
Net-Load Drives Prices
To better understand market dynamics, an example is helpful. Solar penetration in the California Independent System Operator (CAISO) region is vastly greater than in other parts of the country. Millstein explained why that’s significant.
“I think a key concept here is to think about prices being sensitive to ‘net-load,’ or the total amount of demand in any hour minus the total solar and wind generation at that hour,” he said. “So, in midday in CAISO, prices might be lower even than in the nighttime because there is so much available solar generation. Practically, this occurs because solar and wind have close to zero marginal costs—their fuel is free—and therefore, wind and solar push real-time prices down during sunny or windy hours. This can help lower costs for consumers, but it also lowers the prices at which power producers can sell their generation. In CAISO, as solar now accounts for roughly 20% of the annual electricity load, prices are highest right after sunset in the summer, when electricity demand is still high, but solar is no longer available. CAISO prices are now lowest in the late morning—9 a.m. or 10 a.m. local time.”
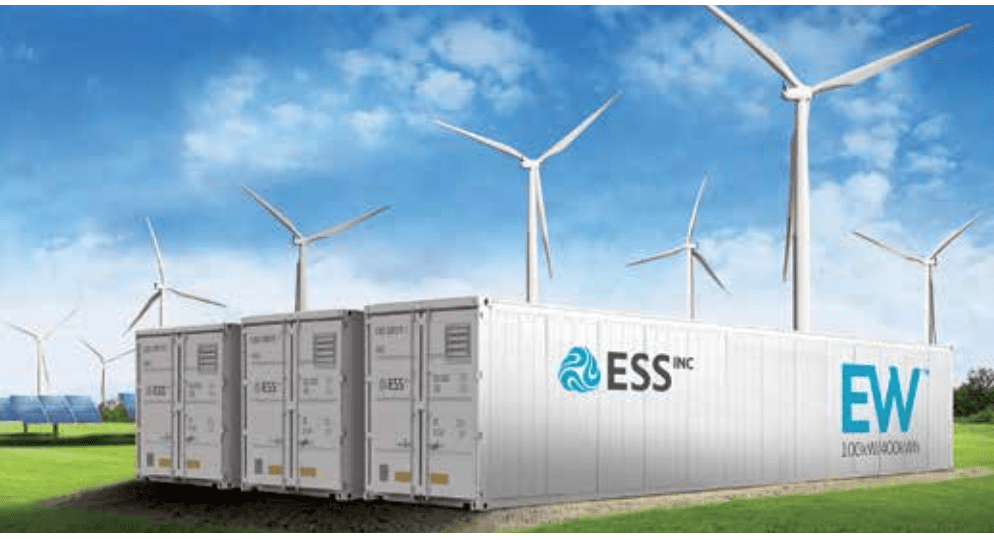
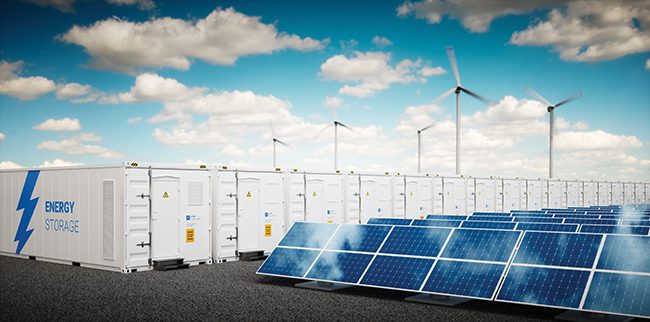
With this type of price action going on in the CAISO market, it’s not surprising that a significant portion of new solar power projects in the region are now being paired with battery storage. These hybrid systems effectively allow the energy produced by the solar system during low-price periods to be stored in the batteries, then discharged several hours later to the grid during periods when prices are at their peaks. That’s one way to keep the economics favorable.
Health and climate benefits were not included in the scope of this particular study. That’s notable because Millstein said in many cases health and climate benefits are larger (on a monetary basis) than grid-system value. “This means that the grid-system value we are reporting on is only a portion of overall value, but this portion of value is important because it influences the cost-benefit trade-off that wind and solar developers experience,” said Millstein.
Q&A with Dev MillsteinThe questions and answers (Q&A) that follow are from an interview conducted by POWER with Lawrence Berkeley National Laboratory research scientist Dev Millstein on July 12, 2021. The interview revolved around the lab’s research on the cost-value proposition for wind and solar installations. POWER: What drove your team to conduct the research and what did you expect to uncover going into the project? Millstein: My team tracks and reports on many aspects of wind and solar development, and markets in the U.S. We look at trends in wind and solar deployment, costs, contracting structures, performance, grid-system market value, value in terms of improving air quality and associated public health, and the value of reducing greenhouse gas emissions. Altogether, this tracking allows us to investigate systematic barriers that the wind and solar sectors face, helping to inform policymakers, industry, and the public. We hope this work helps to guide in the development of solutions to barriers. One important issue that we have been tracking for a while is wind and solar value. We already knew that wind and solar value varies significantly by the location of the plant, and also from year to year. In this work, we wanted to really dig in deep to understand what drives the variation in value between plants, and across time. We felt that for the U.S. system, this type of investigation had not been done at a national scale, so we wanted to fill this knowledge gap. In this project, we focused specifically on grid-system value (not air quality health benefits or climate benefits). We were motivated to have this focus on grid-system value because the balance between grid-system value and the costs of building a plant influences the deployment rate of wind and solar plants. In other words, if costs are generally higher than the expected long-term grid-system value of a wind or solar project, we would expect the deployment rate to slow. We think understanding recent trends in value will also help us understand how value trends are likely to develop in the future. We already expected that, as deployment of wind and solar increased, the grid-system value of wind or solar would decline relative to the average value of generation from all sources. The key question was: would grid-system value decline faster than costs? While it is important to look at both costs and value, this study mainly focuses on the value side. Separate research addresses the details of changes to costs in wind and solar, though here we do compare overall costs and value. We want to understand where, when, and what drives grid-system value for wind and solar. We think that tracking the value of wind or solar generation at each plant, and understanding the reasons for changes to wind and solar value, will help to inform discussion about how to address any observed value decline. The good news is that we found that average costs declined faster than average grid-system value, through 2019 (the end of our study period data). This summary result is maybe not surprising given last year’s record high levels of wind and solar deployments (and also the high number of proposed projects in interconnection queues). That said, we found that grid-system value declines with penetration, and that the reason for this decline varies strongly by region and technology. For wind, a number of regions saw value decline due to transmission congestion, but other regions were not as constrained by transmission, and instead the correlation in generation timing across the region led to value decline. For solar, only California and New England saw value decline, and it was primarily due to output timing, rather than transmission congestion. These different causes of value decline suggest that different strategies would be needed to address value decline in each region. There are many regulatory and policy questions that impact wind and solar grid value ranging from the structure of time-of-use utility rates, to regulations regarding the financing of transmission, or to the particular regulations facing hybrid plants (solar-plus-storage plants, for example). We think that the information provided in this paper could help to inform and further discussions around these issues. Finally, I just want to mention one aspect about our research scope. We did not include health and climate benefits in our scope. But, we have published on these benefits in the past (see “The climate and air-quality benefits of wind and solar power in the United States”). Health and climate benefits from wind and solar are relatively large (when monetized and compared to grid-system value). In fact, in many cases, our past research has found health and climate benefits to be larger, on a monetary basis, than grid-system value. So, this means that the grid-system value we are reporting on is only a portion of overall value, but this portion of value is important because it influences the cost-benefit trade-off that wind and solar developers experience. That said, it is the larger set of values (grid-system value, health value, climate value, jobs, etc.), that motivates the overall interest in wind and solar deployment. POWER: What was the biggest surprise to you? Millstein: No matter how many times I have seen these numbers, I am always surprised by how low the costs of new wind and solar plants have fallen. I find it especially powerful to see the costs lined up against value on a national basis (Figure 1 [Figure 8 in the Joule-published article]).
I think many people are surprised by the mild impact of curtailment on wind and solar value. Curtailment, in general, gets a lot of press, but to date, the actual impact on wind and solar value has been pretty minimal. I think an intuitive reason for this mild impact of curtailment is that curtailment generally occurs when hourly prices are zero (or even slightly negative). Because curtailment generally occurred in low-value hours, it has had, to date, a relatively low impact on total grid-system value. However, the output timing and congestion impacts on value are important, and can reduce value in a system even when there is very little overall curtailment. Two details that I found surprising and intriguing include:
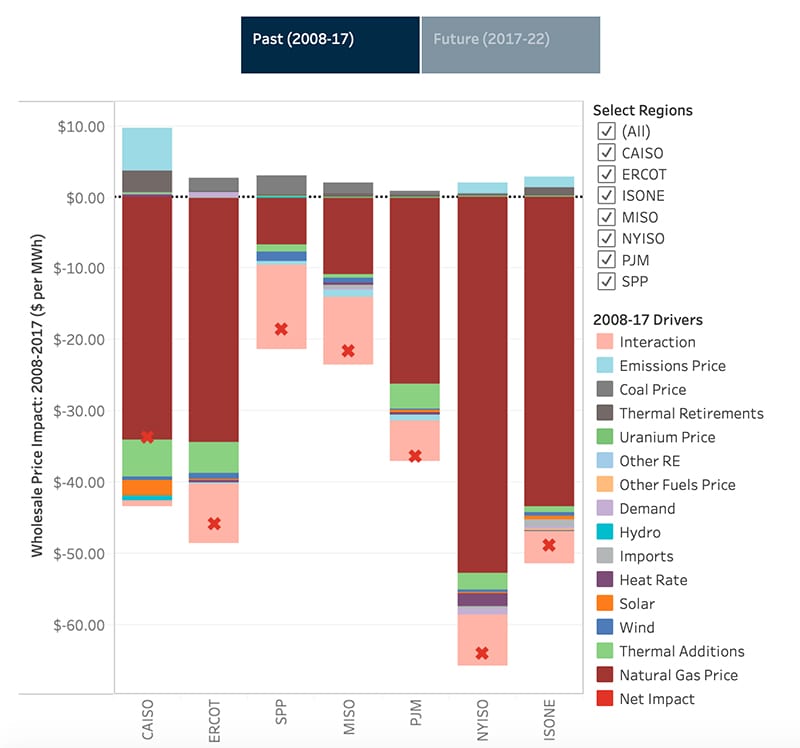
POWER: The output profile component effectively compares the output of generators to the value of power in a local market. Can you explain how that might play out on a typical day? Millstein: I think a key concept here is to think about prices being sensitive to “net-load,” or the total amount of demand in any hour minus the total solar and wind generation at that hour. So, in midday in CAISO, prices might be lower even than in the nighttime because there is so much available solar generation. Practically, this occurs because solar and wind have close to zero marginal costs—their fuel is free—and therefore, wind and solar push real-time prices down during sunny or windy hours. This can help lower costs for consumers, but it also lowers the prices at which power producers can sell their generation. In CAISO, as solar now accounts for roughly 20% of the annual electricity load, prices are highest right after sunset in the summer, when electricity demand is still high, but solar is no longer available. CAISO prices are now lowest in the late morning—9 a.m. or 10 a.m. local time. About a decade ago, prices were instead lower in the middle of the night. (California then had very little solar, but more nuclear power, which generally helped to drive prices down in the nighttime.) By the way, you can see how much prices vary in each market, season, and year by selecting whichever parameters you want, at our cool, free, online visualization tool called “ReWEP.” POWER: Is transmission congestion a fairly consistent thing or does it vary widely based on the day and what is happening on the grid? What factors are significant to the congestion dynamic? Millstein: Congestion value impact does vary by the hour. However, we are reporting annual average congestion impacts for each plant, and on an annual scale, the congestion impacts are much less sensitive to hourly variations. Or really, you might say, for a particular location, and barring other changes, congestion tends to have a similar annual value impact each year. On an annual basis, congestion impacts are most sensitive to new transmission infrastructure (as I mentioned above), and to new deployment of wind or solar plants nearby. Congestion can also be sensitive to total demand levels (such as if a pandemic temporarily reduces demand, it could temporarily increase congestion in some locations and decrease it in other locations), or retirements of other generators (typically, retirements of other generators would mostly reduce congestion). POWER: Can you point to any markets that you think are managing the growth of renewable energy particularly well? Millstein: It seems like the market integration across the West (specifically, the increased coordination of the Western Energy Imbalance Market) has been beneficial to CAISO (and neighboring balancing areas) as they have absorbed significant solar expansion. Likewise, both SPP [Southwest Power Pool] and ERCOT [Electric Reliability Council of Texas] have seen significant wind expansion, and have invested in transmission infrastructure over the years, which has been helpful in integrating these resources into the grid. POWER: What’s the most important thing an ISO or Regional Transmission Organization (RTO) can do to prepare for the future? Should they be diving deeper into the specific findings from their areas and adding transmission in certain places to alleviate congestion? Millstein: The issues related to transmission expansion are varied and complex. There are a few reports that I cite in the paper (in the conclusion section of the Joule article) that discuss transmission development in depth. I think important issues to consider are:
But, there are a wealth of details in the papers I cited. It is also important to think about the differences between intra- and inter-regional transmission. In regions where profile value decline dominates, inter-regional transmission may help reduce value decline, but intra-regional transmission will provide only limited easing of value decline. Separately, relevant to profile value decline, there are a significant number of regulatory issues that ISOs, PUCs [public utility commissions], or FERC [the Federal Energy Regulatory Commission] could address related to hybrid plants. These plants are relatively new, and as such, the regulations around these plants are also new, and could perhaps be improved. My group published a paper on the largest barriers to hybrid plant deployment (see “Motivations and options for deploying hybrid generator-plus-battery projects within the bulk power system”). POWER: What’s your biggest takeaway from the study? Millstein: To date, costs have declined more quickly than grid-system value, allowing for strong wind and solar growth. Despite this positive result, value decline is important to consider into the future. The causes of wind and solar value decline vary by type and region, and so targeted strategies can help to address value decline. POWER: Is there anything else you feel is important to mention? Millstein: This paper reported the value of stand-alone wind and solar. A significant portion of new solar projects are now coming paired with battery storage. Recent work shows that these hybrid plants have significantly more value than stand-alone solar plants. So, in addition to transmission, which we discussed above, storage is also a key aspect of efforts to address value decline. |

—Aaron Larson is POWER’s executive editor.