Falling natural gas prices tamped down annual U.S. wholesale power prices over the last decade by $7/MWh to $53/MWh—to a much higher degree compared to the impact of wind and solar growth—a new report from Lawrence Berkeley National Lab (LBNL) suggests.
The Nov. 20–published report, The Impact of Wind, Solar, and Other Factors on Wholesale Power Prices: An Historical Analysis—2008 through 2017, studied price dynamics between 2008 and 2017 using a supply curve model, as well as hourly wholesale prices at more than 60,000 pricing nodes to gauge the impacts of wind, solar, and other factors on geographic and temporal pricing patterns.
It notes that average annual wholesale prices have declined substantially since 2008. While these price declines vary sizably by region, they have accelerated thermal plant retirements, increased baseload generator cycling—and generally prompted calls for interventions in wholesale markets, including market design revisions, to slow the pace of coal and nuclear plant retirements.
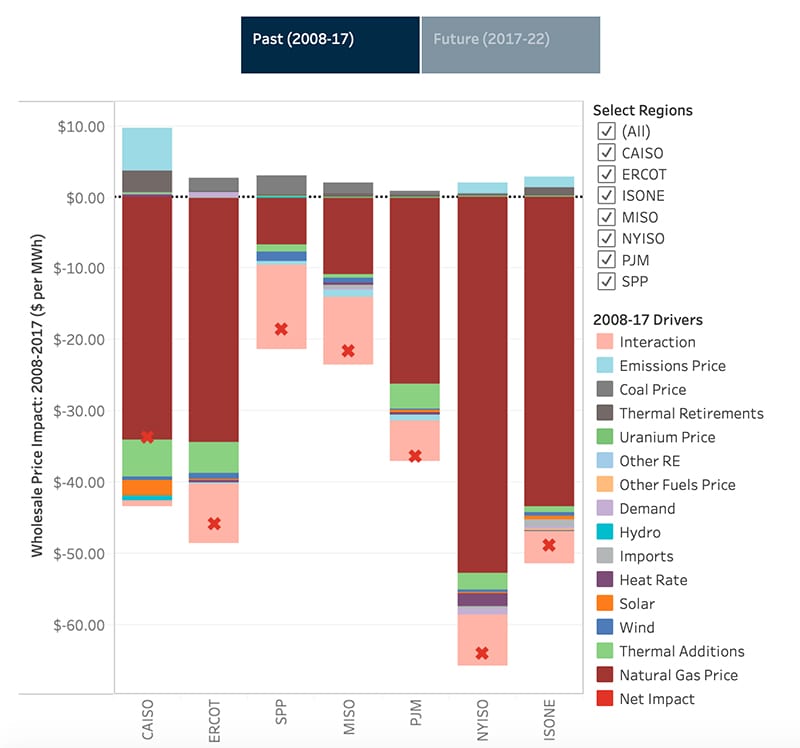
Source: Berkeley Lab, The Impact of Wind, Solar, and Other Factors on Wholesale Power Prices: An Historical Analysis—2008 through 2017, November 2019. Click to access interactive graphic.
One key finding settles a widely held misconception that wind and solar growth—driven by state renewable portfolio standards and other incentives—across all ISO/RTO markets have widely and forcefully affected wholesale prices. The study suggests that over the last decade, wind and solar growth reduced average wholesale prices by less than $1.3/MWh in most markets—California being the exception, where growth in solar reduced prices by $2.2/MWh. However, it notes, California’s experience is “perhaps foreshadowing greater impacts from solar in other regions as solar penetrations grow.”
Perhaps more remarkable is wind and solar growth’s impact on prices in some locations and in altering how prices change based on the hour of the day and season. Over the last decade, wind and solar growth has emerged as a sizable factor driving more frequent negative pricing, it suggests. “Specifically, growth in wind and solar impacted time-of-day and seasonal pricing patterns, growth in the frequency of negative prices was correlated geographically with deployment of wind and solar, and negative prices in high-wind and high-solar regions occurred most frequently in hours with high wind and solar output.”
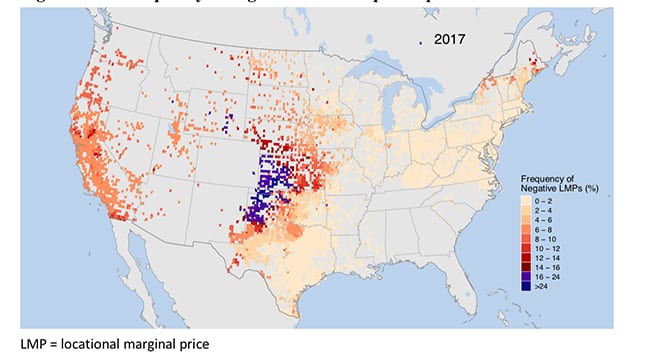
However, the report also notes that despite the “recent increase” in the frequency of negative prices, annual average prices at most locations were not heavily impacted by negative-price hours because negative prices were “mostly small in magnitude.” Still, some regions saw “significant declines” in annual average prices owing to negative pricing, including parts of the Midwest in the Southwest Power Pool, California, and northern areas of New York, New Hampshire, and Maine.
Also significantly, negative pricing did not affect all generation equally, it points out. “In 2017, negative prices decreased the average annual real-time energy price at nodes near wind plants by about 6%, at nodes near solar plants by about 3%, and nodes near hydropower plants by about 3%. Pricing nodes near coal, gas, and nuclear plants saw a smaller reduction of about 1.5%, though those (modest) impacts have slightly increased over time.”
Wholesale prices were also affected by the expansion and retirement of thermal generation, changes in demand, generator efficiency, coal prices, variations in hydropower, and emissions prices. Separately, markets have also evolved to better respond to the increased variability of wind and solar, in part by encouraging supply-side and demand-side flexibility, it notes.
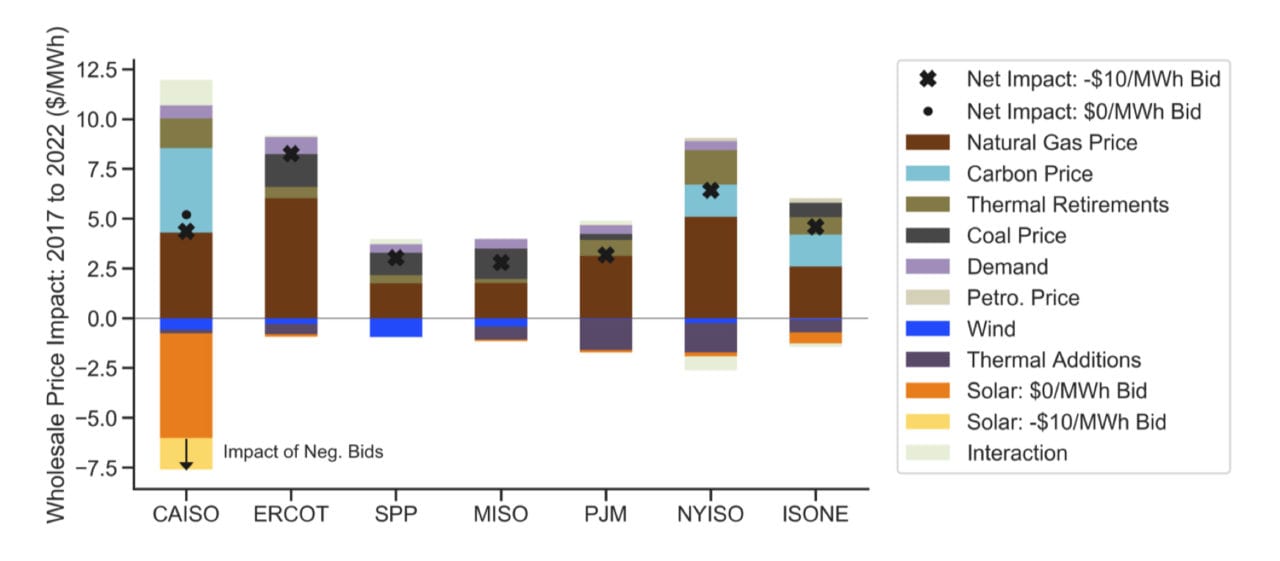
Between 2017 and 2022, average wholesale power energy prices could change based on various factors across all markets. Basing its projections on a simple supply-curve model based on the Energy Information Administration’s (EIA’s) projections of demand based in its 2018 Annual Energy Outlook (AEO) reference case, the report suggests that major contributors to price increases will hinge consistently on natural gas prices, and to a lesser degree, increases in carbon prices in California and states that are part of the Regional Greenhouse Gas Initiative, which include the ISO-NE and NYISO markets.
It also projects “notable increases” in coal prices, which could drive up wholesale prices in MISO, ERCOT, and SPP. However, the report cautions that the results should not be construed as precise forecasts for future regional wholesale prices or price trajectories. “In particular, the lack of storage in the simple supply-curve model will tend to overstate the magnitude of the impact of growth in solar,” it says.
—Sonal Patel is a POWER senior associate editor (@sonalcpatel, @POWERmagazine)