The Texas power market made headlines in August 2019 when wholesale prices for electricity repeatedly spiked close to and even hit the $9,000-per-megawatt-hour (MWh) cap. This August, average hourly prices peaked at “just” $1,700 per MWh, the afternoon of Aug. 15.
There were many reasons for the reduced price volatility in Texas this year. First, it was hotter in Texas in August 2019, reaching 104 degrees in Houston on Aug. 13 and 14, versus this year’s high of 99 degrees on Aug. 16.
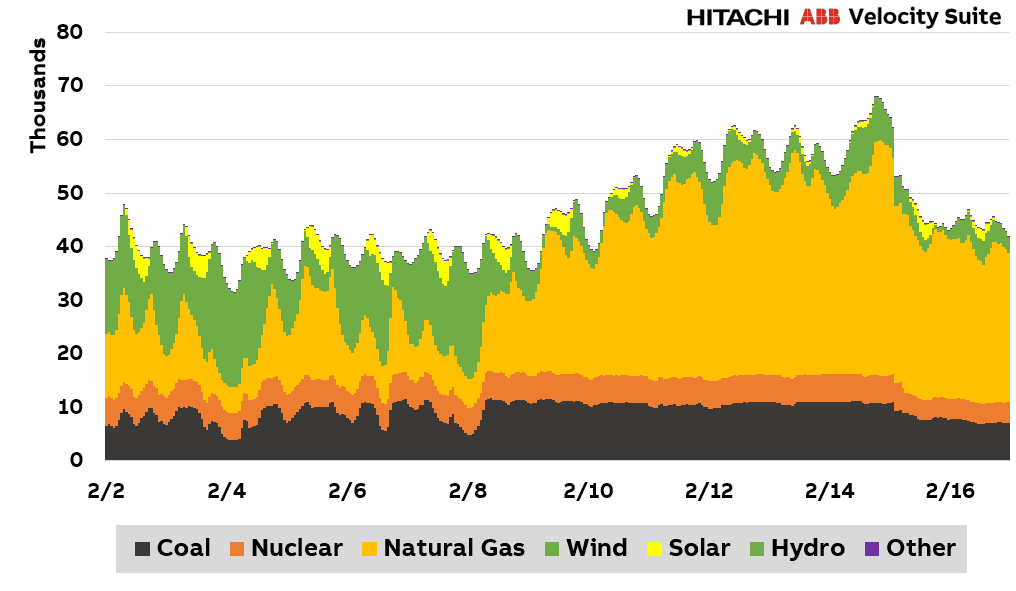
Peak demand was close to the same—74,820 MW on Aug. 12, 2019, versus 74,164 MW on Aug. 13 of this year, across ERCOT, the main Texas grid. But ERCOT’s reserve margins have increased since last year with the addition of new capacity—most notably solar.
COMMENTARY
And Texas also benefited from relatively strong wind speeds in August 2020, helping supply keep pace with demand.
To see how wind and solar producers were financially impacted this August versus last, we used our company’s new information tool, REmap, which allows us to dig into how weather and power market volatility affect the value and risk of renewable energy generation.
‘Shape’ Of Texas Wind This Summer Spared Price Spikes
In ERCOT, we see that production-weighted prices for wind projects in August 2020 ranged from good to not-great. Most wind projects saw production-weighted prices in the high $10s to low $20s per MWh. Projects near the Gulf Coast were again the standout, getting into the $40s and $50s per MWh.
As we added data for this August and removed last August, the trailing 12-month average pricing for wind projects decreased across all of ERCOT’s major trading hubs, with prices now close to or dropping below all-time lows. But financial performance for clean energy buyers and sellers should also be measured through the “shape” metric.
Shape measures the value of a clean energy project’s generation relative to the value of baseload power. So for example, a renewable energy project that generated power only worth an average of $20 per MWh during a month when baseload power averaged $30 per MWh would have a negative $10 per MWh shape.
The August 2020 shape (Figure 1) for wind projects ranged from -$15 per MWh relative to baseload, to more than +$16 per MWh, with the vast majority of operating projects falling toward the bottom of that range. While this is admittedly a volatile range, it pales in comparison to last summer, which saw wind project shape values as negative as -$111/MWh and as positive as $84/MWh.
Across both summers, the highest positive shape values were reserved for the few projects operating directly along the ERCOT coastline.
Solar Outperformed Wind, Though Moreso in 2019
For solar producers in ERCOT, meanwhile, production-weighted prices in the real-time market ranged from the low $50s per MWh to the low $60s per MWh. These prices were much higher than wind, but a far cry from last August, when Texas solar fetched rates nearing $350 per MWh.
Solar shape in ERCOT this August ranged from positive ($17 per MWh relative to baseload) to very positive (into the $30s per MWh). In August 2019 that positive shape ranged from the $80s to north of $200 per MWh—reinforcing how last August was comparatively more volatile, but also resulted in a higher payout for solar projects across the board.
However, it is worth highlighting here that a positive shape as compared to baseload power does not necessarily mean strong financial performance for a solar project, as its hedging strategy can cause high sensitivities to poorly-timed cloud cover.
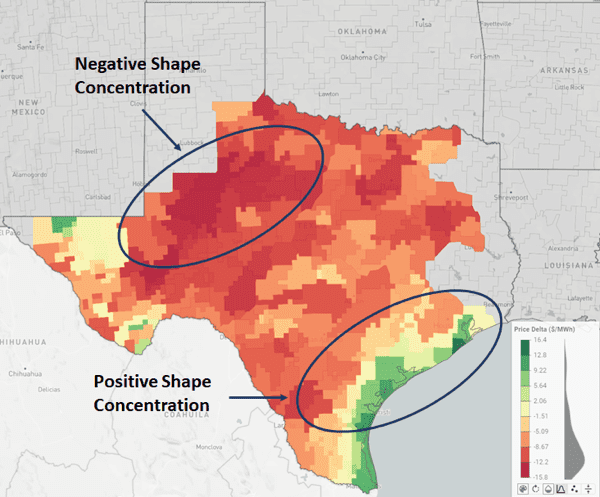
The image below (Figure 2) shows the shape value of solar in August 2020 when we compare the as-generated value of power against the average hourly generation profile (the “12×24 shape value”)—a structure that is used in some financial hedges for solar projects.
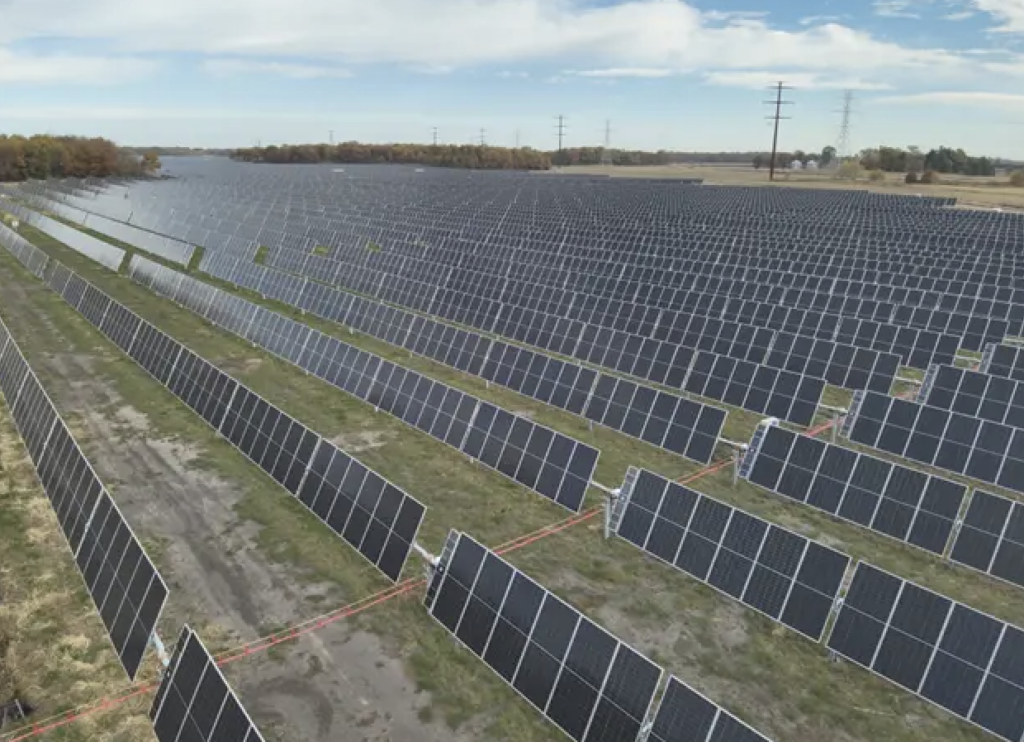
The cause of the disparity between the shape winners and shape losers during this period was primarily driven by a few hours of cloud cover, seen in the accompanying cloud cover photograph. (There was a similar story to tell in California this August, with ill-timed cloud cover hurting solar generation during price spikes).
REmap lets us leverage atmospheric science, power market modeling and big data to bring unprecedented transparency and insight to the clean energy industry — empowering better decisions, faster.

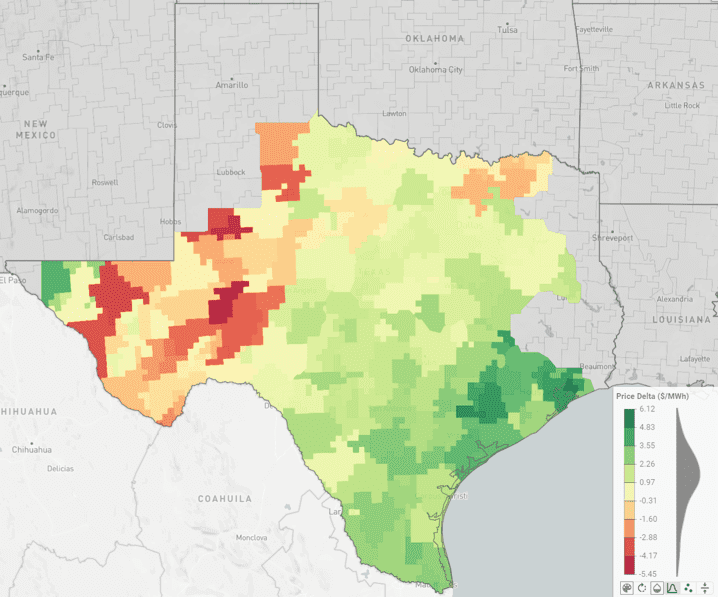
The lessons we draw from examining August 2020 and August 2019 region- and project-level performance highlight how weather and its timing can impact clean energy financial performance. Temperature, wind speed, and cloud cover (Figure 3)—and when they occur—are increasingly the drivers of success for a given project or off-take contract.
—Lee Taylor is founder and CEO of REsurety Inc., which provides tools to help understand and manage the risks associated with intermittent generation of wind and solar power.
Disclaimers: Certain risk management tools offered by REsurety involve utilizing products regulated by the U.S. Commodity Futures Trading Commission. Such tools involve risk and are not suitable for all clients. All information, communications, publications, reports, and other materials, including this document, which may be utilized or distributed by REsurety, should be construed and considered solicitations relative to entering into a derivatives transaction. Trading commodity interest products, which include swaps, involves substantial risk of loss and may not be suitable for all investors. You should carefully consider whether trading is suitable for you in light of your circumstances, knowledge, and financial resources. You may lose all or more of your initial investment.