Rising power costs and load increases have elevated energy monitoring and analysis on plant agendas, but consumption only becomes controllable once it is reliably measured per unit produced and modeled alongside the throughput, quality, and uptime that drive productivity.
Electricity demand in North America is growing faster than it has in decades, driven by electrification, reshored manufacturing, and new data center construction. Power generators are running units at higher capacity factors, while industrial consumers face higher rates, longer interconnection waits, and new requirements to publicly report energy metrics. Because it takes years to add supply, the quickest way to free up new capacity is to run processes more efficiently.
However, finding areas to reduce consumption is difficult because most plants measure power consumption in the way a utility bills it: one number for the site, once a month, after the energy is gone. Energy intensity is a more useful figure, representing the energy consumed per unit produced, such as kilowatt-hours per ton or per case. Measured this way, energy behaves like any other process variable, which can be modeled, controlled, and optimized.
Meters Measure Buildings, Not Production Lines
Metering boundaries rarely match those of plant processes. A single electrical meter often serves multiple production lines, as a compressed-air header feeds a whole building and a boiler creates steam for both process and space heating for an entire facility. Most sites know their total consumption, but they cannot attribute how much is consumed by specific lines, products, or shifts.
Meter types differ as well. Some report a running total, while others provide an instantaneous rate, and reading units may even differ. Few systems record what equipment was running when a reading was taken, which matters because a line drawing power while producing nothing still consumes at close to normal rates.
These same qualities apply outside manufacturing as well. In a data center, cooling and power distribution account for most energy not delivered directly to servers, and metering is usually tracked at the building rather than in each hall. Chiller sequencing and uneven load between halls respond to the same balance, anomaly detection, and optimization steps applied on a packaging manufacturing line.

In This Issue
Full issueThroughput, Quality, and Uptime Drive Consumption
While metering gaps are measurable, the larger obstacle is energy usage managed separately from production. Consumption per unit produced rises when a line runs below rated speed, when a batch is scrapped and remade, or when a compressor runs during a shutdown. None of those causes appear on a power meter, so this data alone cannot explain energy intensity.
Corporate reduction targets are often set without considering the relationship between consumption and production, and few plants can calculate what a given energy cut would cost in throughput or scrap. In these cases, engineering, operations, and sustainability teams work from different numbers and reach different conclusions about the same plant or production line.
Building an Energy Balance from First Principles
A credible energy program starts by constructing an energy balance describing how energy moves through a facility. Physical meters rarely exist at the level needed, so modern energy optimization software solutions address this by creating soft meters, which divide up measured energy across a plant hierarchy according to equipment states, run hours, and production data (Figure 1). Measurements are then aggregated back up the hierarchy, so consumption stays accurate at the asset, line, and site levels simultaneously.
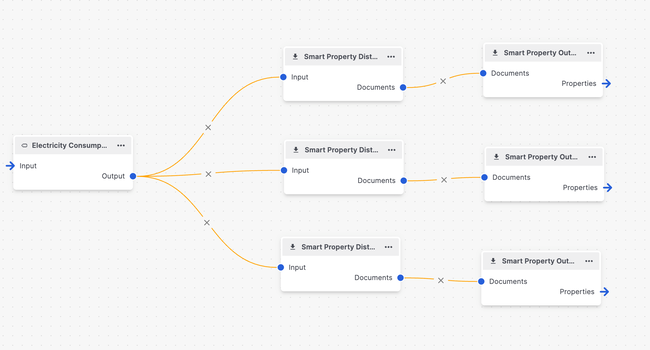
Three calculations make this allocation reliable. First, rate readings and running totals are converted to consumption over identical time intervals, so meters that report a rate and those that report a running total can be summed. Second, all readings are converted into the same engineering units, so electricity, steam, and compressed air are expressed in common energy and cost terms. Third, every consumption reading is tagged with the equipment’s operating state at that moment—running, idle, or down—so energy used while equipment sits idle or offline is not counted the same way as if it were running and producing product.
Dividing consumption by production then yields energy intensity per product, line, and shift. Models trained on this history define normal consumption for a product on a line, along with ideal consumption from the best runs on record. The difference between the two is recoverable energy in kilowatt-hours per unit, which can be easily converted to monetary figures.
Catching Abnormal Consumption Automatically
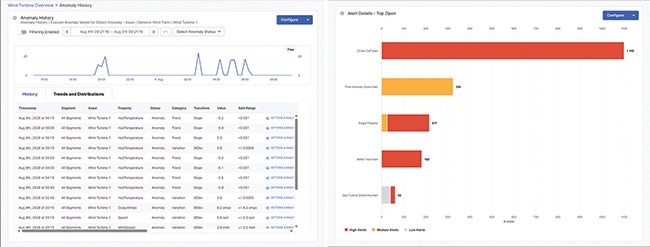
A plant with intensity metrics for every production line and product displays more numbers than a typical team of operators can watch. Anomaly models address this shortcoming by automatically comparing each variable against limits learned from operating history and scoring how far current consumption sits from normal requirements. These run continuously in the background with a goal of reducing swing between runs.
An alert only saves energy if someone acts on it, so workflow engines must route each finding to a specific action. This might be a setpoint change recommended at the human-machine interface (HMI), a work order opened in the maintenance system, or a setpoint automatically passed to the control system. It is a common scenario to detect excessive power draw during low or no production, meaning some equipment is still fully powered after production has stopped.
Because each alert records its likely cause, a site builds a list of the conditions that recur most often, informing where project money should be spent (Figure 2).
Balancing Energy Against Throughput and Quality
The largest consumers do not always represent the greatest optimization opportunities. For example, a boiler running near its design efficiency may consume more energy than a chiller loop while offering less to recover, while the chiller may waste a large share of its load due to poor sequencing. Savings models must therefore consider baseline operation and rank opportunities by recoverable energy, rather than total consumption.
Actions to reduce consumption mean changing process conditions, which can also affect output. First-principles, statistical, and machine learning models are built for each indicator—energy intensity, throughput, quality, and uptime—then combined into a single model that identifies the lowest consumption available without pushing the other objectives beyond their limits (Figure 3). The models then retrain as recipes and equipment change.
The output is a startup recipe for each product on a production line, plus real-time setpoint recommendations while the line runs. Process engineers review these automatically generated recipes and apply appropriate guardrails to ensure that model recommendations are safe and appropriately applied.
After proving the approach on a single production line, the next step is applying it to others. Scaling depends on defining an asset class once and applying standard metrics, logic, models, and workflows. Standardizing configuration in this way also empowers process, operations, and data science specialists to maintain a standardized view across multiple plants in an enterprise.
Results: Optimizing Energy Intensity Across a Manufacturing Enterprise
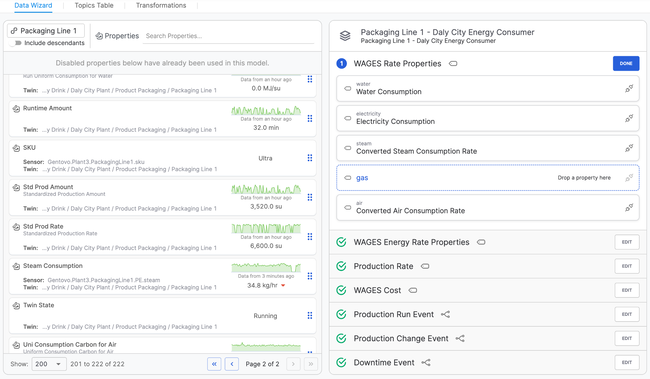
A global manufacturer of consumer packaged goods (CPG) applied this approach over many sites to meet a corporate energy intensity commitment. Equipment in scope included chillers, compressors, boilers, making lines, and packaging lines. With process historians and a manufacturing execution system (MES) already in place, plant teams implemented TwinThread’s Perfect Energy—an energy optimization software solution—to create a digital twin of each line, which autonomously configured anomaly models, dashboards, and alerts (Figure 4).
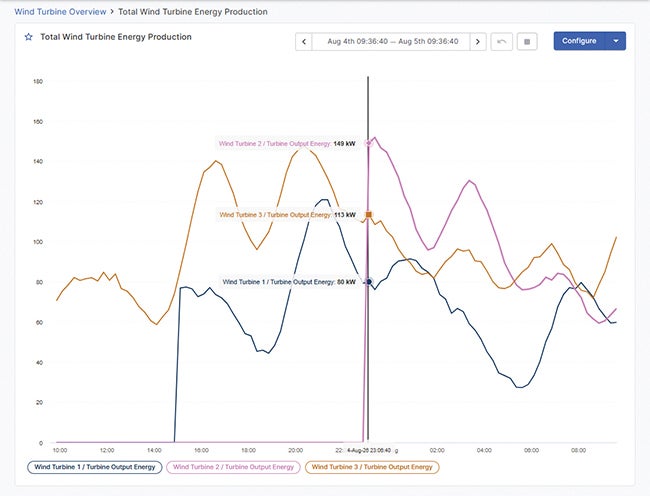
The implementation team integrated energy recommendations into existing reporting workflows, including daily production meetings, routine maintenance activities, and periodic performance audits (Figure 5).
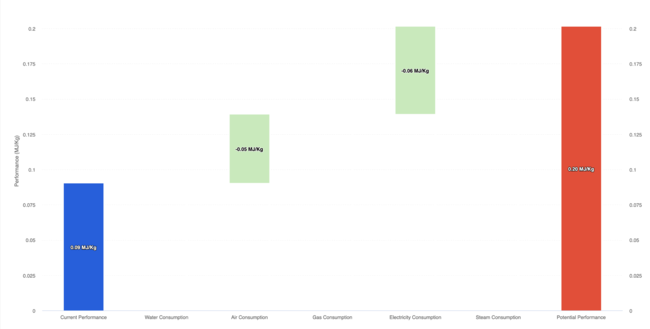
Curated data also fed the central data lake and the dashboards executives already used, removing the manual work of assembling sustainability reports. After rollout, this deployment reduced enterprise-wide energy intensity by more than 5%, amounting to millions in savings.
Start With Available Data
Energy optimization is often postponed because it is commonly believed that equipment and instruments must be updated to relieve bottlenecks. However, most plants can begin to optimize using just the data already stored on their servers, guiding energy balance efforts. A missing measurement can often be calculated from related variables using “soft sensors,” then energy optimization solutions can be used to model and rank ideal opportunities for savings.
For power producers and industrial energy consumers, reducing energy intensity matters more as rates rise and reporting requirements expand. It is therefore becoming increasingly critical to model energy usage alongside throughput and quality, providing a clearer picture of productivity and operational efficiency line by line.
—Erik Udstuen is co-founder and CEO of TwinThread.