Traditional power plant performance indicators do not always provide reconcilable data. This means plant personnel may be making operational changes based on inaccurate information. An innovative data validation and reconciliation modeling method could greatly reduce uncertainty and allow proper decisions to be made.
The power industry is changing, and the methods used for tracking plant performance need to change with it. The industry has been reliant on traditional monitoring methodologies for years, but there’s a new method that promises better results: Data Validation and Reconciliation (DVR) modeling. DVR methods have been developed to help address poor data quality. They provide a way to accurately determine key performance parameters for a fossil cycle.
Historically, important performance indicators have been determined using measured plant data, which is obtained during plant testing or pulled from a data historian. The same measurement data is often used as input for plant operations, equipment monitoring, unit heat rate curve development, billing and accounting, emissions monitoring, maintenance scheduling, and other important business and operational purposes. These measurements are performed by equipment and instrumentation in sub-optimal condition, and therefore have the potential for significant bias error in the values. Traditional plant monitoring strategies cannot account for this, so biased measurement data has inevitably been used as input for business and operational decisions.
DVR methods minimize the potential effect of significant bias error in process data. By utilizing measurement redundancy and uncertainty for the entire process, and applying mass and energy conservation laws, plant operators are able to identify measurements that are biased, and allow for their correction. Additionally, DVR can monitor the process for the data set that represents the true state of the system, thereby allowing ongoing system monitoring and calculation of accurate performance indicators.
Understanding the Basics of DVR
All measurements taken by instruments are subject to measurement error. The type of instrument used, where and how it is installed, and degraded conditions will influence the amount of error. A 100% perfect measurement system just doesn’t exist, so it’s better to understand the error and to account for it. DVR methodology identifies the amount of error that is most probable for a measured value—how far the measurement is from the “true” value.
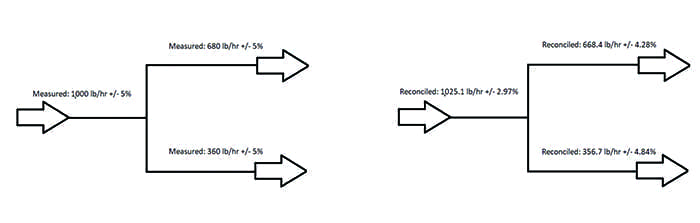
The basic idea of the DVR method is to establish redundancies between process measurements, and apply the measurement uncertainties, and mass and energy balances, to the system to determine a solution that best satisfies the physical constraints. Figure 1 helps illustrate the DVR methodology. In it, one measured flow splits into two separate parallel flows, and each flow is measured. For such a configuration in reality, the conservation of mass dictates that the parallel flowrates should sum to equal exactly the inlet flowrate.
 |
|
1. The pipe configuration shown here illustrates a situation where one measured flow splits into two separate parallel flows. However, the actual instrument-measured flowrates (shown on the left) do not satisfy mass conservation laws. The reconciled results (shown on the right) reduce uncertainty and represent the most probable true state of the system. Courtesy: GSE Solutions |
However, these are not perfect flowmeters. Each has an uncertainty of +/–5% of the measured flowrate. This is reflected in the summing of the measured flowrates shown on the left of Figure 1. The total measured outlet flow of 680 lb/hr + 360 lb/hr = 1,040 lb/hr, which does not match the measured inlet flow of 1,000 lb/hr, and therefore mass conservation is not satisfied.
This example shows functional redundance. The redundancy present in the system allows for the measurements to be reconciled, or corrected, to satisfy the mass balance. The mathematics for this reconciliation process are described in the German standard VDI-2048.
The reconciliation process accomplishes two things. First, the measured values are converted to values that satisfy the mass and energy balances. Second, the uncertainties associated with each measurement are also reconciled to achieve a more accurate description of the process.
The reconciled results and uncertainties are shown on the right side of Figure 1. You can see in this illustration that the inlet flowrate is equal to the sum of the outlet flowrates. Additionally, the uncertainties for each flowrate measurement have decreased. This set of reconciled results represent the most probable “true” state of the system, according to the measured values and input uncertainties.
Real-world power plant applications use models that describe the entire process, and therefore, are much more complex. However, the same principles apply. The number of measurements in a typical power plant allow for a significant degree of redundancy to be established, thereby achieving reconciliation for the system.
Applying DVR Software Modeling Methods to a Fossil Plant
Dedicated DVR modeling software is used to model power plants and provide reconciled operating data. For coal-fired power plants, this includes modeling of the boiler, water/steam and turbine-generator cycle, and heat rejection systems.
 |
|
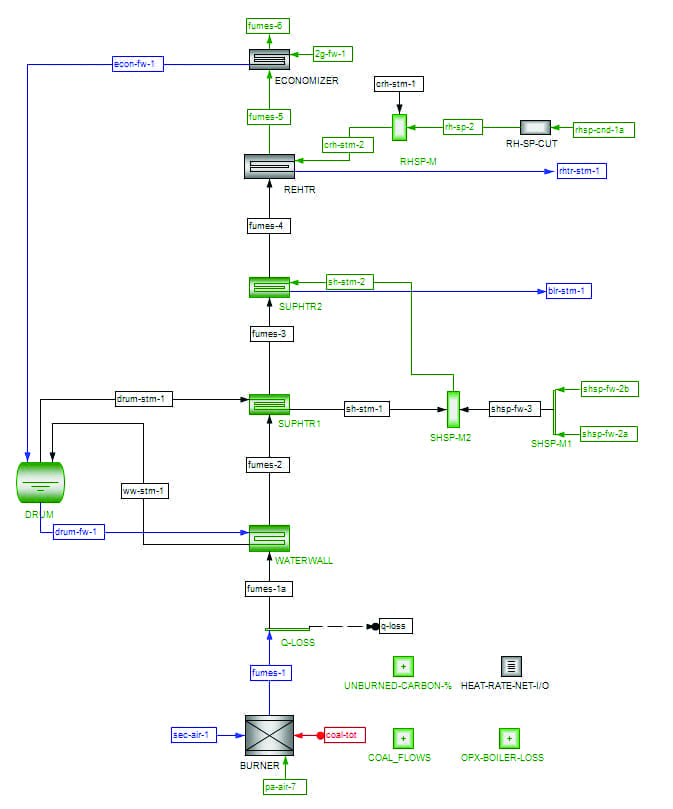
2. The process flow diagram shown here includes tags for components and streams that would be used to model boiler operation. With the right inputs and reconciliation, uncertainties can be reduced and the most probable true state of operation established. Courtesy: GSE Solutions |
The basic layout of the model is made of components representing major equipment (such as turbine stages, heat exchangers, and pumps) and streams that connect these components (representative of the piping or duct work that carries the working fluid). “Tags” are placed on these components and streams to represent the measured values (Figure 2), and a user-input measurement uncertainty is associated with each tag. The input uncertainties are chosen based on an evaluation of the type and quality of the instrument that is providing that measurement, along with any operational evidence regarding the quality of the measurement.
A basic boiler model will consist of the following:
- ■ Fuel and combustion air delivery streams.
- ■ Burner components where the combustion process occurs.
- ■ Flue gas streams that carry the thermal energy resulting from combustion.
- ■ Heat exchanger and drum components that represent the boiler waterwall, superheating/reheating bundles, and air heaters.
- ■ A stream that represents the stack outlet flow.
It is also necessary to introduce “pseudo-measurements” into the process. These measurements represent values that are not necessarily measured online but instead are obtained from test or sample results, or from assumptions. This includes the fuel heating value and the unburned combustible percentage, both of which are typically obtained from periodic sampling. Using the values for fuel mass flowrate, fuel heating value, excess oxygen, and unburned combustibles, the model is able to determine the total combustion air mass flowrate and in turn the total amount of energy released during the combustion process. Additional important pseudo-measurements used in a coal-fired boiler DVR model include:
- ■ Air and fuel moisture content (if not measured online).
- ■ Fuel hydrogen content.
- ■ Boiler heat losses.
- ■ Additional unmeasured losses, similar to those assumed for an abbreviated boiler efficiency test.
These pseudo-measurement tags are given uncertainties that are evaluated in order to bound the amount of variation that could be expected in the variable during operation. The overall boiler energy balance is driven by the flue gas energy lost, as it travels from the burner component to the stack, and the water and steam cycle energy gained, as it travels across the boiler envelope. The heat input at the burners and the final flue gas outlet temperature measurements are the primary drivers to determine the overall amount of energy lost by the flue gas. The water/steam cycle measurements determine the amount of energy gained by the steam cycle.
Energy in equals energy out. Therefore, the energy lost by the flue gas must equal the energy gained by the steam cycle, after considering the previously mentioned losses. Applying DVR, redundancies can be established between the measurements on the combustion side and on the water/steam side.
 |
|
3. Nearly every instrument will have some measurement error. The key to efficient plant operation is to minimize uncertainty as much as possible so sound decisions can be made by operators. Courtesy: GSE Solutions |
Typically, measurements made on the water and steam cycle (Figure 3) have less uncertainty associated with them than for measurements made on the combustion side of the boiler—this is particularly true for the measured fuel flowrate. Additionally, there are often more functional redundancies between measurements on the water and steam cycle. The benefit of establishing redundancy between the combustion and steam side is that this causes the reconciled results for the combustion process variables to have significantly lower uncertainties than the raw measured values have.
The reconciliation solution process is similar to a least-squares regression on an overdetermined system. The model will solve for the solution that places the smallest possible corrections on the measured values while satisfying the mass and energy balances. The magnitude of the correction made on a measurement is a function of the redundancies associated with that measurement, as well as the uncertainty placed on the measurement. A measurement with a large uncertainty suggests that it is more probable that that measurement has a larger bias error, and therefore a larger correction can be applied while still remaining within the bounds of the tag uncertainty and solution process.
Business Benefits of DVR
There are many proven benefits of using DVR modeling. A well-built and tuned DVR model is capable of identifying bias errors in process measurements that would otherwise go unnoticed. During the model tuning process, measurements that have significant bias errors are identified and considered for their effect on the reconciled results. There are several performance indicators that are used to verify the validity of the reconciled results as a whole, as well as indicators for flagging measurements that are providing readings outside of what is probable (VDI-2048 uses a 95% confidence interval for analysis).
 |
|
4. Coal power plants use fuel flow measurements in several performance calculations. If the measurements are not accurate, plant personnel cannot optimize operations appropriately. Courtesy: GSE Solutions |
In a real-world example, DVR modeling of a coal-fired power plant identified significant bias errors in the plant’s total fuel flow measurement to the boiler. The reconciled results identified that the total coal flow measurement was likely reading more than 15% higher than the actual flowrate (Figure 4). This resulted in the unit having falsely high unit heat rates calculated in the past, thereby affecting the dispatch order.
The DVR output uncertainty for the net unit heat rate was significantly lower than the uncertainties from using the traditional input-output method. Due to the large uncertainties associated with the solid fuel mass flowrate measurement, sometimes a typical input-output net unit heat rate uncertainty for a fossil plant can be +/–10% or higher. The DVR model provided reconciled uncertainties for the fuel flowrate that were much lower, allowing for net unit heat rate uncertainties to be in the +/–2% or lower range.
Once measurements with significant error are identified, proper corrective action can be taken by plant operators. This may include instrument calibration or replacement. Through this practice, many instrument calibrations can be performed as-required, instead of through planned maintenance. Additionally, a well-tuned DVR model can identify significant cycle isolation leakage that can negatively affect plant efficiency and productivity. The reconciled outputs of a DVR model will represent minimal bias error for each measured value, and therefore the results can be confidently used for operational and business purposes. ■
—Greg Kanuckel is a senior thermal performance engineering consultant with GSE TrueNorth (a part of GSE Solutions). He has experience in applying DVR modeling for plant monitoring and identifying performance issues in nuclear, fossil, and combined cycle plants. Frank Todd is a senior technical specialist with GSE TrueNorth’s Thermal Performance Group. He has more than 40 years of experience in the power generation sector.