FERC Tackles Modernization of U.S. Power Markets
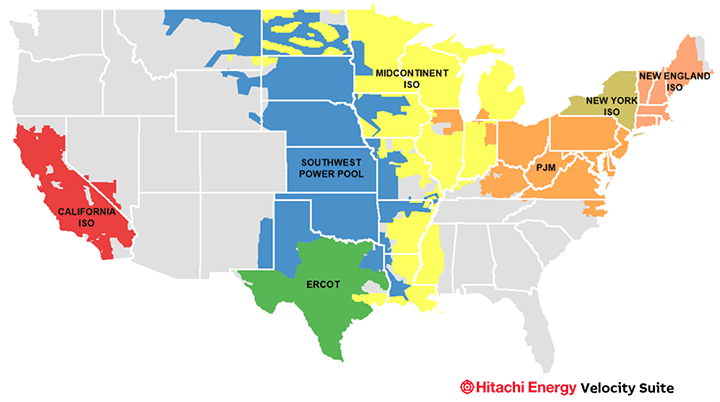
The seven major organized electricity markets scattered across the U.S. account for roughly two-thirds of all power generated in the country. Most of these markets are made up of Independent System Operators (ISOs) and Regional Transmission Organizations (RTOs) that were created more than twenty years ago. The primary mission of the markets is to neutrally manage large segments of the power grid efficiently, cost-effectively, and reliably. Driven by the tremendous growth in wind and solar resources in recent years, the original market rules, developed to accommodate mostly traditional resources like baseload coal and nuclear power, need to be updated to better accommodate flexible resources.
In this new transitioning market, the primary question is: How can flexible resources be adequately compensated while simultaneously maintaining a reliable and resilient grid? That has been the driver behind several Federal Energy Regulatory Commission (FERC) technical conferences this year. The most recent occurred on October 12, addressing the challenges and opportunities of optimizing energy and ancillary services markets. The heavily attended FERC meeting, the fourth in a series, highlighted the importance of how new modern electricity market design is needed to accommodate the rapid changes occurring across the power industry. The combination of diverse energy resources, capacity, and fast-responding flexible resources such as quick-responding natural gas turbines, energy storage, and new technologies to improve power quality are paramount to keeping the lights on.
Key questions facing the industry include redefining procurement processes and evaluating the pricing of market products. Each ISO/RTO is comprised of different resource mixes that create different design issues, and some markets are further along than others in addressing resource needs. To better visualize the resource shifts that have occurred in various ISOs/RTOs (Figure 1) over the past two decades and where those markets are headed, the research staff at Hitachi Energy’s Velocity Suite have prepared a few charts.
What Is the Current Makeup of Operating Capacity Across Markets Today?
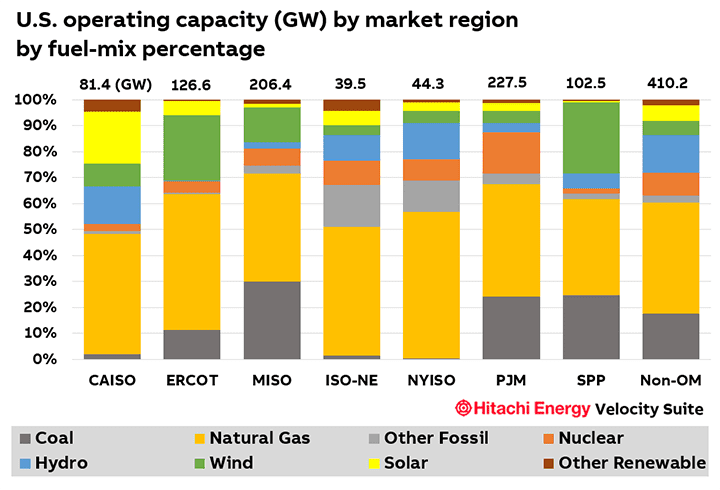
The seven organized markets vary in terms of operating capacity by fuel. Utility-scale solar represents more than 21.1% of all operating capacity in the California ISO (CAISO), while the Southwest Power Pool (SPP, 27.5%), Electric Reliability Council of Texas (ERCOT, 25.1%), and Midcontinent ISO (MISO, 13.5%) have built large wind footprints in recent years. ERCOT is home to the largest number of wind turbines with more than 31.8 GW of installed capacity.
Across all markets, the combination of natural gas combined cycle and gas peaking capacity dominates, particularly in the New York ISO (NYISO, 56.5%), ERCOT (52.4%), and ISO-New England (ISO-NE, 49.6%). The PJM Interconnection is host to the largest fleet of nuclear power plants with 15.9% of the system’s capacity coming from nuclear. The non-organized markets (Non-OMs) across the country are host to the most diverse fuel mix and the largest footprint overall with natural gas (174.7 GW), coal (72.8 GW), hydro (59.7 GW), and wind and solar combined (46.9 GW) leading the way. The Non-OM is made up of utilities and generation companies spread mostly across the western and southeastern U.S., where organized markets are yet to form (Figure 2).
How Have the Markets Produced Electricity Over the Past Two Decades Since the Advent of the ISO/RTO Model?
Over the past two decades, most markets have experienced an increase in the production of electricity from natural gas while coal has been in decline. Power production by wind and solar was hardly noticeable in the 2001–2010 period, but with recent additions has begun to contribute significantly across all regions.
Comparing the two decades, coal has decreased by 32.8% while natural gas production has increased by 65.6%. Wind (up 545%) and solar (up 1,148%) represented the largest percentage gains (Figure 3).

What Type of Resources Are Currently Under Construction or Holding Permits to Build in Various Markets?
Virtually all capacity additions currently under construction or permitted to build are solar, wind, and natural gas. Most of the capacity on the fast track is in ERCOT, where 28.4 GW of utility-scale solar and wind are currently under construction or permitted to build. Solar accounts for 68.6% of the new build capacity, while wind represents 22.7%. PJM has a significant buildout ongoing with 21.6 GW of capacity under construction or permitted—most is natural gas (63%) with solar (24.4%) and wind (11.7%) accounting for most of the rest.
Solar and wind dominate new builds in MISO with 8.5 GW (77.9%) of capacity currently under construction or permitted. Overall, across the seven markets and the non-OM regions, solar represents 44.7% (49.1 GW) of total capacity currently in construction and permitted to build (Figure 4).

More to Come
Along with the recent technical conferences focused on how to support needed flexible resources through capacity and ancillary service markets, back in mid-July the FERC initiated the rarely used Advanced Notice of Proposed Rulemaking (ANOPR) to expedite and improve current transmission planning, cost allocation, and interconnect approval efforts. All meetings and initiatives are signs of the dedication and desire to solve current market obstacles that could inhibit the continued expansion of carbon-free resources during the years to come.
Topping the list of market goals is reliability—customers depend on it. The recent rapid growth in variable resources like wind and solar have created a higher demand for fast-responding flexible resources. This is the crux of the need to modernize the market design that was originally written to manage an abundance of traditional resources like coal and nuclear power but now must contend with rapidly changing grid conditions driven more by weather than generator or transmission failure.
The future is dominated by wind and solar, and the closure of more and more aging coal, nuclear, and natural gas plants. With more variable resources, the need for flexible grid solutions increases. Overhauling current market design precepts is critical to better optimize the grid for reliability and resilience while continuing to keep customers happy.
—Kent Knutson is an energy market intelligence specialist at Hitachi Energy. He has more than 30 years of experience designing and developing intelligence products for some of the largest information providers in the power generation and transmission industries.