Distributed energy resources (DERs) may be a competitive concern for traditional electric generators, but for independent system operators, DERs offer both benefits and challenges. Here’s what POWER learned about how system operators are responding to DERs.
What are distributed energy resources (DERs)? For many people, rooftop solar is the first thing that comes to mind, but when you ask that question of an independent system operator (ISO)—the folks who coordinate, control, and monitor North America’s electric transmission grid—the answer you get is likely to include much more than just rooftop solar.
They will also mention small-scale wind or biomass generation, energy storage, plug-in vehicles, demand response, energy efficiency programs, and even some natural gas– and diesel-fueled reciprocating engines. In fact, in the Electric Reliability Council of Texas (ERCOT) region, fossil-fueled distributed generation (DG) makes up the majority of DERs. (For more on the big picture of DERs, see “Evolving Roles for the Grid and Generation” in this issue.)
Although each ISO or regional transmission operator (RTO) seems to have its own DER definition, for most it includes generation resources on the distribution system (normally less than 69 kV) that are typically connected to end-use customers and located behind the customer’s meter. Some ISOs have size limitations for DERs, such as less than 5 MW in New England, but the one definitive descriptor is that the resources do not generally participate in the ISO markets. (Although this is changing. See “U.S. Microgrid Market Development” in this issue.)
And therein lies one of the biggest challenges for ISOs: The DERs are not visible to them. ISOs operate the transmission grid and have a limited view of the distribution network (see the sidebar “How Does the North American Electric Grid Work?”). DERs simply reduce the amount of energy that would otherwise have been needed from other resources on the regional power grid. In other words, they make demand appear lower than it actually is.
|
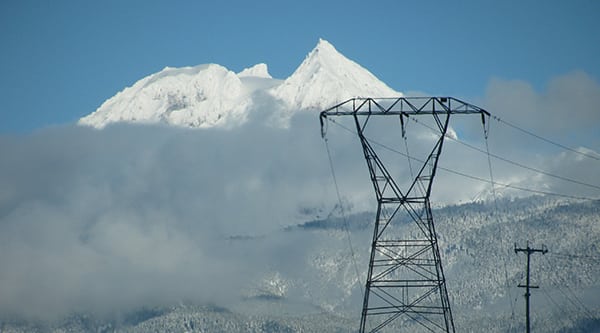
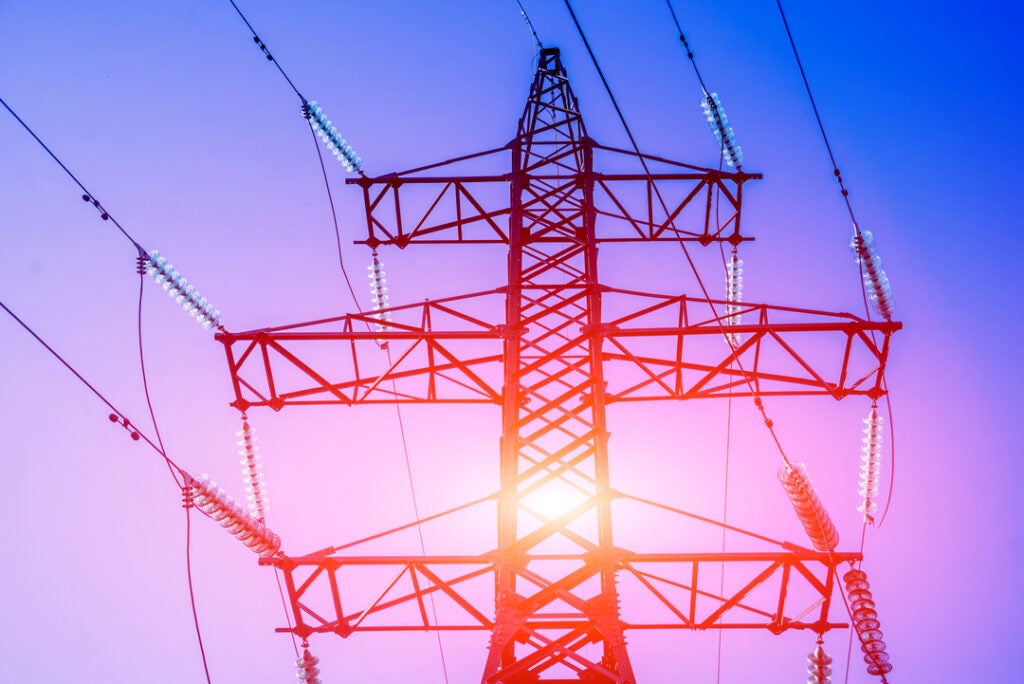
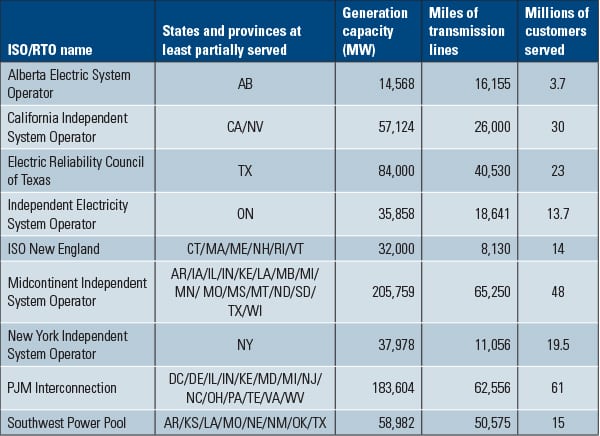
How Does the North American Electric Grid Work? The North American electrical grid is an interconnected network of power lines and associated equipment for moving electricity from suppliers to consumers. It is made up of generation, transmission, and distribution. The generation piece should be familiar to POWER’s audience, but the distinction between transmission and distribution may not be quite as well known. In general, transmission lines are high-voltage lines with ratings of 69 kV or greater that are used to move power from generating facilities to substations. Distribution lines are the lower-voltage wires that deliver power to most end users. The continental U.S. and Canada are divided into four electricity interconnections: the Eastern Interconnection, the Western Interconnection, the Quebec Interconnection, and the Electric Reliability Council of Texas (ERCOT). Although the boundary dividing the Eastern and Western Interconnections is far from straight, it essentially runs between Alberta and Saskatchewan, and then cuts over to the eastern borders of Wyoming, Colorado, and New Mexico, before ending inside Mexico. Wholesale electricity markets are generally broken into two types. One type has organized competitive markets operated by independent system operators (ISOs) or regional transmission organizations (RTOs). While there are differences between ISOs and RTOs, it is beyond the scope of this article to differentiate between the two. We will use the more general term ISO to represent both. The other type of wholesale electricity market consists of regulated bilateral markets. There are nine ISO/RTO service areas in North America (Table 1). The ISO manages the transmission system while individual owners and operators of generation submit offers to supply electricity on a competitive basis. This arrangement allows generation, transmission, and retail service to be owned by separate entities within the region. In regulated bilateral markets, vertically integrated electric utilities control the transmission system and choose which generation is dispatched.
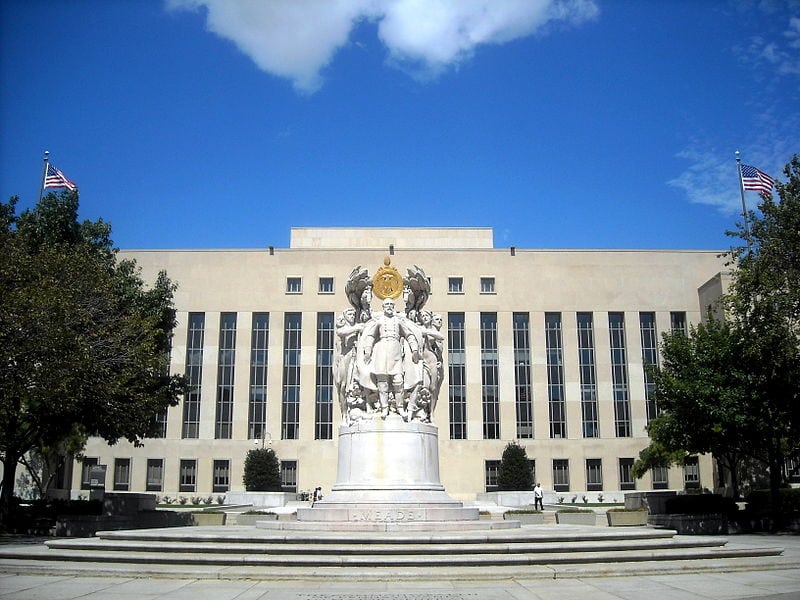
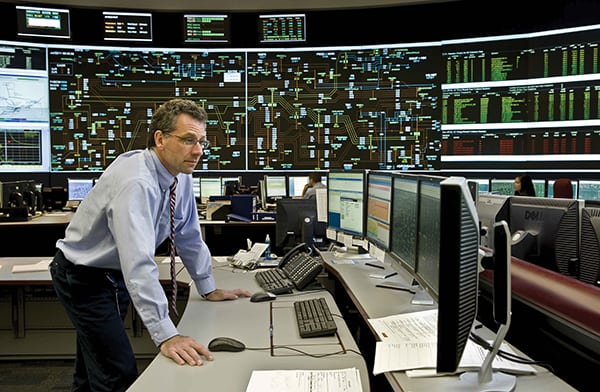
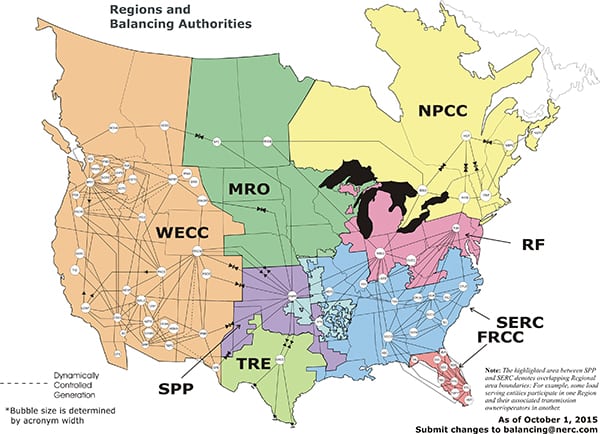
Large control centers—or balancing authorities—are staffed to monitor and match the supply and demand of electricity in the various transmission control areas that make up the North American grid. As of October 1, 2015, there were 75 of these nerve centers in the U.S. and Canada continuously fine-tuning system parameters. Operators at some of these locations use advanced forecasting tools and geospatial maps with multiple layers of data shown on video screens up to 80 feet wide to do their jobs (shown in the opening photo). They utilize wind and solar availability patterns to help predict renewable production and issue dispatch instructions to generators in their power pools to balance supply and demand. When power needs to be moved (“wheeled”) from one region to another, they coordinate with adjacent control centers to make that happen. Sophisticated computers are constantly taking the pulse of the grid, providing a continually updated picture so operators can manage resources and react to emergencies—all of which allows the North American power grid to reliably deliver 830 GW to 334 million people 24/7/365. |
CAISO: A Pioneer in DER Integration
California offers a natural starting point for any discussion involving DERs. The state leads the nation with 489,778 interconnected solar photovoltaic (PV) net energy-metering systems installed, with a total capacity of 3,868 MW as of March 23, 2016. California also has a fairly aggressive self-generation incentive program, which provides support for the installation of clean and efficient DERs, including wind turbines, microturbines, fuel cells, advanced energy storage systems, and more.
Although statistics on residential and nonresidential (Figure 1) solar installations are recorded and maintained by the state, the California ISO (CAISO) told POWER that it does not perform any analysis of retail sales growth of DERs and said it doesn’t speculate on trends. It said behind the end-use customer meter resources are passive, so they do not participate in the ISO market and are not visible to CAISO.
 |
|
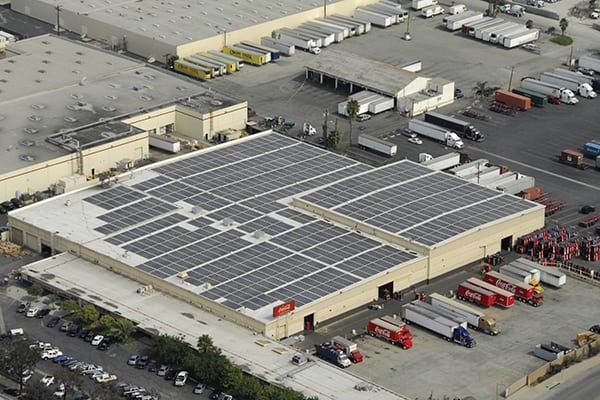
1. Power drinks. Rooftop solar is not just for homes; Coca Cola’s Los Angeles distribution warehouse has been using the 325-kW system shown here for more than 12 years. Courtesy: Go Solar California |
However, rooftop solar does change the demand curves used by CAISO in its day-ahead market, which commits non-DER resources to generate power to meet the expected demand, while also ensuring transmission capacity is available for its delivery. CAISO said it only sees the impact of rooftop solar when clouds block the sun and all of that demand suddenly shows up on its forecast curves.
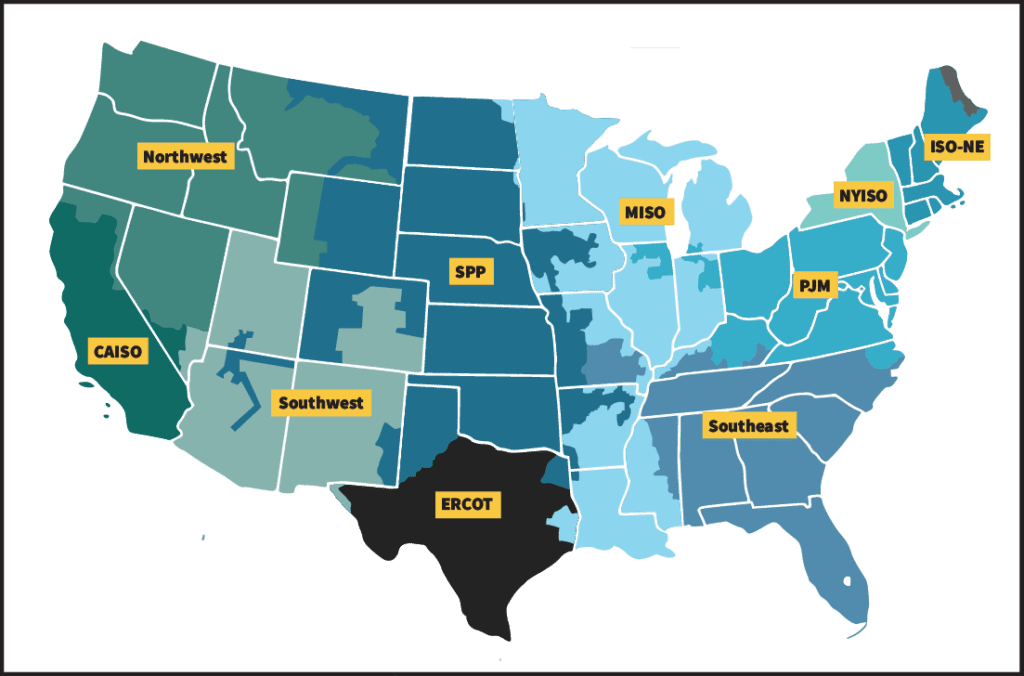
To help address the challenge, CAISO proposed tariff revisions in March. The proposal—submitted to the Federal Energy Regulatory Commission (see sidebar “Know Your Acronyms: FERC, ERO, and NERC”)—would establish an initial framework to enable aggregations of DERs connected to distribution systems within CAISO’s balancing authority area (Figure 2) to participate in its energy and ancillary services markets. For instance, the framework would facilitate wholesale market participation by microgrids interconnected to distribution systems, third-party aggregators operating DERs, or a utility distribution company operating those resources.
|
Know Your Acronyms: FERC, ERO, and NERC The power industry is filled with acronyms (as is this article). The following three represent entities that are instrumental in maintaining a reliable power grid. FERC. The Federal Energy Regulatory Commission (FERC) is the independent agency that, among other things, is responsible for regulating the transmission and wholesale sales of electricity in interstate commerce; reviewing certain mergers and acquisitions, and corporate transactions by electricity companies; reviewing siting applications for electric transmission projects under limited circumstances; protecting the reliability of the high-voltage interstate transmission system through mandatory reliability standards; monitoring and investigating energy markets; and enforcing FERC regulatory requirements through imposition of civil penalties and other means. ERO. Following a cascading blackout that left about 50 million people in parts of Ohio, Michigan, New York, Pennsylvania, New Jersey, Connecticut, Massachusetts, Vermont, Ontario, and Québec without power in August 2003, U.S. lawmakers passed the Energy Policy Act of 2005. It called for an electric reliability organization (ERO) to be certified by FERC for the purpose of establishing and enforcing reliability standards, subject to FERC review, for the bulk power system. NERC. The North American Electric Reliability Corp. (NERC) was founded in 1968 by representatives of the electric utility industry, for the purpose of developing and promoting voluntary compliance with rules and protocols for the reliable operation of North America’s bulk power electric transmission systems. In July 2006, FERC certified NERC as the ERO for the U.S. NERC develops and enforces reliability standards; annually assesses seasonal and long-term reliability; monitors the bulk power system through system awareness; and educates, trains, and certifies industry personnel. NERC’s area of responsibility spans the continental U.S., Canada, and the northern portion of Baja California, Mexico. NERC is subject to oversight by FERC and governmental authorities in Canada. |
 |
|
2. It’s a balancing act. As recently as six years ago, there were more than 145 balancing authorities in the U.S. and Canada, but that number has been nearly cut in half to 75 today. Each control center is indicated on this map as a white, acronym-filled bubble. Courtesy: North American Electric Reliability Corp. |
CAISO believes the change would add operational flexibility to its system, but it stressed that the revisions are only a first step. As it gains operational experience with the DER aggregations, it expects to be better able to consider future refinements and enhancements. If approved, the revisions could go into effect as early as June 3, 2016.
Another effort that CAISO has under way to lower barriers and enhance the ability of transmission grid–connected energy storage and DERs to participate in the ISO market is its Energy Storage and Distributed Energy Resource (ESDER) stakeholder initiative. CAISO launched the first phase of the ESDER initiative in June 2015 to identify and consider potential enhancements to existing requirements, rules, market products, and models for energy storage and DER market participation.
Phase two of the initiative began with the release of an issue paper on March 22. There are four opportunities for stakeholders to submit comments throughout the process before the ISO board meets to consider the final proposal in October.
ISO-NE: Powering the Northeast
Although New England has some of the poorest solar insolation—that is, the amount of solar radiation (electromagnetic energy) incident on Earth’s surface—it has seen dramatic growth in solar PV facilities. According to ISO-New England (ISO-NE), the region’s installed PV has grown from less than 50 MW at the beginning of 2010 to 1,325 MW by the end of 2015, most of which is behind the meter.
The New England states have a variety of policies encouraging the development of PV, such as net metering and DG “carve-outs” within state renewable portfolio standard programs, which ISO-NE expects will continue driving solar development. As growing levels of PV have affected bulk power system operations, ISO-NE has worked to develop the nation’s first multistate, long-term PV forecast. The forecast focuses on distributed solar located at customer sites on the distribution system, rather than on larger facilities connected to the ISO’s high-voltage power grid.
The draft forecast, updated March 7, 2016, predicted PV capacity in ISO-NE would increase to more than 3,200 MW by 2025. As a result of that estimate, ISO-NE has reduced its 2019–2020 installed capacity requirement, which is the amount of capacity it needs to procure in forward capacity market auctions.
An ISO-NE spokesperson told POWER that distributed PV is already affecting consumer demand profiles served by its high-voltage power system. For that reason, it is working to develop short-term forecast methods to accurately predict distributed PV’s hour-by-hour effect. Part of that effort includes ISO-NE’s participation in the Watt-Sun project.
Watt-Sun is an ongoing project, sponsored by the Department of Energy in partnership with the IBM Thomas J. Watson Research Center, designed to improve the science of solar forecasting. The technology under development is expected to leverage deep machine learning and self-adjusting voting algorithms to decide between various forecasting models and expert systems. In theory, this approach will yield the best forecasts, and more importantly, continuously improve and adjust as the system is operating and evolving. Similar projects are under way in other parts of the country.
ERCOT: The Lone Star State Grid
Contrary to what some people might expect, considering the relatively high solar insolation in Texas, very little solar capacity has been installed in the state. To grasp why that is, a person has to understand the playing field.
The ERCOT system—representing about 90% of the state’s electric load—is divided into competitive choice areas, covering about 74% of the market, and non-opt-in entities (NOIEs), covering the remaining 26% of the grid. The competitive choice areas were formed in 2002 as a result of deregulation.
Natural gas is abundant in Texas and gas prices are low. For that reason, natural gas has filled the marginal fuel role for the region’s grid, and electricity rates have been cheaper than nearly anywhere else in North America. Therefore, there really hasn’t been a lot of incentive for DG in the competitive market. Even so, certain NOIEs, which are mainly municipally owned utilities and cooperatives, have implemented some incentives for DG, which has resulted in DER growth in the NOIE areas.
In the ERCOT region, DG falls into one of two categories: registered or unregistered. Owners of DG with capacity greater than 1 MW that inject power onto the system must register with ERCOT, while other DG resources can remain unregistered. Paul Wattles, senior market design analyst for ERCOT, said that there was virtually no DG installed in the region 10 years ago (other than backup generation at hospitals or data centers, which is not typically used other than during emergencies).
It has grown though, particularly following Hurricane Ike, which hit the Texas Gulf Coast in September 2008. In fact, following that disaster, the state began requiring some water utilities to obtain backup power, such as DERs, for pumping stations and treatment facilities. Today, the installed capacity of registered DG in ERCOT is somewhere between 500 MW and 600 MW, most of which is fossil-fueled generation. The estimated unregistered capacity is around 100 MW, mostly solar.
“At some point, if DG penetration reaches some level to be determined, it will start impacting transmission grid operations,” Wattles said. “We’re not there yet. We’re not even really close here at ERCOT.”
In the meantime, ERCOT is taking steps to develop a framework to better accommodate DERs and enable their effective and efficient market participation. ERCOT issued a concept paper in August, detailing some changes in market rules, such as pricing DERs at the nodal level, which it believes would provide long-term benefits for the system.
To understand how that would function, you have to look at how the system currently works. The ERCOT region consists of four competitive load zones: North, South, West, and Houston. Under existing ERCOT guidelines, DER pricing occurs at the zonal level. However, standard generation units receive localized, or nodal, pricing. The nodal prices are all the same when there is no congestion on the system, but when there is congestion, the prices deviate.
Prices go up in locations where a generator could help solve a congestion problem, which offers an incentive for plants to come online or increase generation, if they can. Prices go down, and can even go negative, in an area where the generation is not needed, which encourages operators to shut units down. However, the zonal rates may not fully recognize the cost of congestion in their prices, because it gets averaged over a much larger area. The fact that DERs do not get that nodal treatment often dilutes incentives that could otherwise provide significant benefits to the grid, such as reducing the congestion, so ERCOT thinks the change is worth pursuing.
IESO: Canadians Go Green
Ontario enacted its Green Energy and Green Economy Act in 2009. The act was created to expand renewable energy generation, encourage energy conservation, and promote the creation of clean energy jobs, but it also paved the way for Ontario’s feed-in-tariff (FIT) program. The FIT program allows homeowners, communities, business owners, and private developers to generate renewable energy and sell it to the province at a guaranteed price for a fixed contract term.
The Independent Electricity System Operator (IESO)—Ontario’s ISO—administers the FIT program, which has been very successful in spurring DER growth in the region. In fact, Ontario is second only to California in terms of solar penetration at the distribution level (Figure 3). More than 3,200 distribution-connected FIT contracts have been executed, totaling more than 1,900 MW of contracted capacity since the program was launched.
 |
|
3. No fiddling on this roof. Ontario, Canada’s most populous province, is second only to California, the most populous U.S. state, in terms of solar penetration at the distribution level. Courtesy: IESO |
The FIT program is designed for renewable energy projects with capacities between 10 kW and 500 kW. A more streamlined version—called microFIT—is available for projects smaller than 10 kW. Another 2,100 contracts and 187 MW have been added as a result of that program. The IESO is expecting another 3,500 MW of distribution-connected wind and solar by 2020.
An IESO representative told POWER that, in aggregate, the DERs are starting to have a material impact on the bulk power system, especially when it comes to forecasting demand in real time. In 2011, the IESO, through its renewable integration initiative, implemented new processes for direct telemetry and reporting to increase visibility and integrate resources into its near-term forecasts. But that only applied to large-scale generators (5 MW and greater), so the hourly operations of most DERs are still unknown to the IESO.
On the technological front, the IESO has observed both new technologies and new contexts for using existing technologies to better manage and integrate the growing DER segment. For example, it has found that technologies offering specific benefits for DER integration include smart inverters, microgrid controllers, advanced distribution management systems, and energy storage technology.
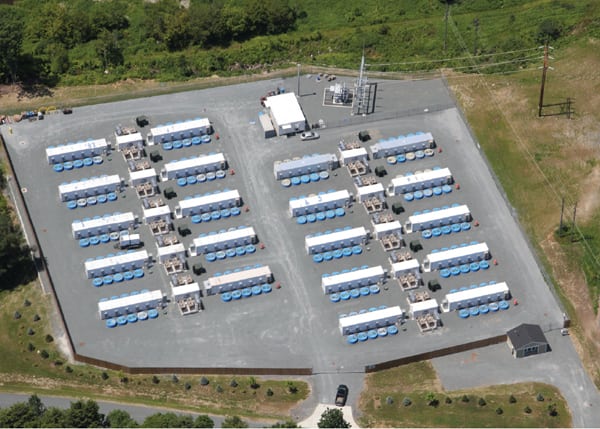
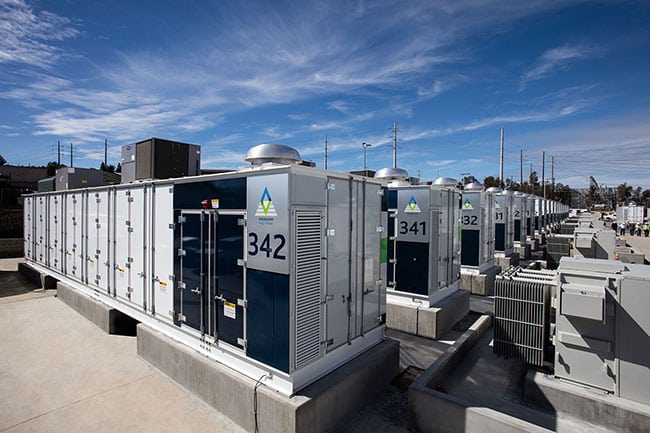
In 2012, feeling that quick frequency regulation response was becoming increasingly important due in part to the variable output of DERs, the IESO began a project designed to evaluate the ability of alternative technologies to provide frequency regulation service. Three different technologies—battery energy storage, flywheel energy storage (Figure 4), and load aggregation assets—were selected for testing on its system so that the IESO could gain a better understanding of the benefits of each.
 |
|
4. Innovative frequency regulation. Ontario-based Temporal Power supplied the flywheel technology used in an energy storage facility designed to provide +/–2 MW of frequency regulation for the IESO. One of the flywheel assemblies, which utilize an all-steel rotor and magnetic bearings, is being rigged into place in this picture. Courtesy: IESO |
“Real-time, real-world experience with new sources of regulation will allow us to see how non-traditional resources behave,” Paul Murphy, then-president and CEO of the IESO, said following vendor selection. “Engaging and empowering new participants will provide much needed flexibility in the way we run the power system, which is important in the context of our changing supply mix.”
All three systems have now been commissioned and are currently providing the contracted regulation service. In November, the IESO entered phase two of its procurement plan by issuing contracts for nine more energy storage projects totaling 16.75 MW.
PJM and AESO: The Big and Small of It
Because PJM Interconnection is one of the largest ISOs/RTOs, it’s probably not surprising that the current mixture of DERs in its footprint has little to no effect on its system. At the other end of the spectrum, the Alberta Electric System Operator (AESO)—the smallest ISO in terms of customers served—has very little DER capacity installed on its system, so it too has seen no significant effect. But both see growth and are taking proactive steps to get ready for more DERs.
AESO has focused its effort on distribution facility owners. It has engaged with them to get a better understanding of their needs and requirements. Like other ISOs, AESO is also working on ways to get better visibility of the resources.
PJM has concentrated on improving systems and developing tools to more effectively deal with DERs. Some examples include the development of a generation attribute tracking system and a dispatch integrative map application. PJM has also modified load forecasting methodology, worked with IEEE to develop smart inverter standards, and participated on a NERC variable generation integration task force.
Educating stakeholders has also been a PJM priority. That effort is designed to more widely communicate generation resource rules; demand response rules; PJM market rules and regulations for interconnection and wholesale market participation; potential changes to PJM interconnection queue rules; and potential rules changes for DERs.
In general, all of the ISOs and RTOs see the writing on the wall. DERs are growing, and there is little likelihood of that changing in the near future. For that reason, they are all working on initiatives to effectively deal with these new resources. ■
— Aaron Larson is a POWER associate editor.