In Part III of this three-part report, we look at plant- and fleet-level metrics used to determine compensation. As expected from this EUCG-sponsored benchmarking survey, there is broad use of quantifiable metrics to set portions of compensation, but the metrics selected vary substantially across the surveyed utilities. More surprising was the number of utilities that used no performance metrics as part of their employee compensation packages.
In the March and April issues we examined plant- and fleet-level fossil plant performance metrics in the first two parts of this summary of a recent EUCG benchmarking survey. In this final report, we explore which metrics are favored by the participating companies for employee compensation.
The survey did not delve into specific compensation practices or the portion of the total compensation package that is affected by these key metrics because that information is usually confidential and often varies greatly between companies. Rather, the survey was focused on identifying metrics favored by company compensation programs and their usage frequency.
The survey was conducted in mid-2010 with a total of 16 major utilities from the U.S., Canada, Israel, and South Korea. Each utility’s fleet was categorized by size: small (up to 5 GW), medium (5 GW to 10 GW), or large (over 10 GW). Of the 16 companies participating in the benchmarking survey, eight were classified as having “small” fossil-fueled fleets, three as “medium,” and five as “large.”
The survey covered all fossil plants within particular fleets, including coal-fired and natural gas–fired steam units, combined-cycle plants, and even combustion turbines used for emergency peaking. Survey respondents also operate in different regulatory environments; some are fully regulated while others operate in deregulated regions, competing with merchant generators for energy and capacity sales.
Many Metrics, Few Used
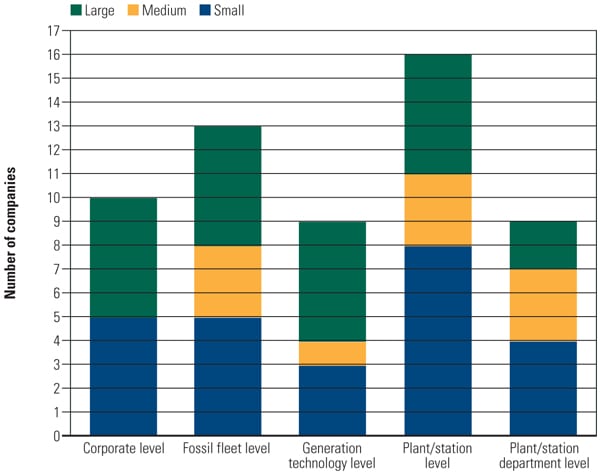
Of the 16 utilities surveyed, 13 (81%) reported using some combination of station- and/or fleet-level performance measures for a portion of their employee compensation. At the station level, five of the participating companies (one large, two medium, and two small) did not use performance measures as part of their employee compensation computations. Of those that did, the number of performance measures considered in the compensation program varied from one to 34 (Figure 1). Of those companies that reported using metrics in their compensation decisions, an average of 10 metrics were used.
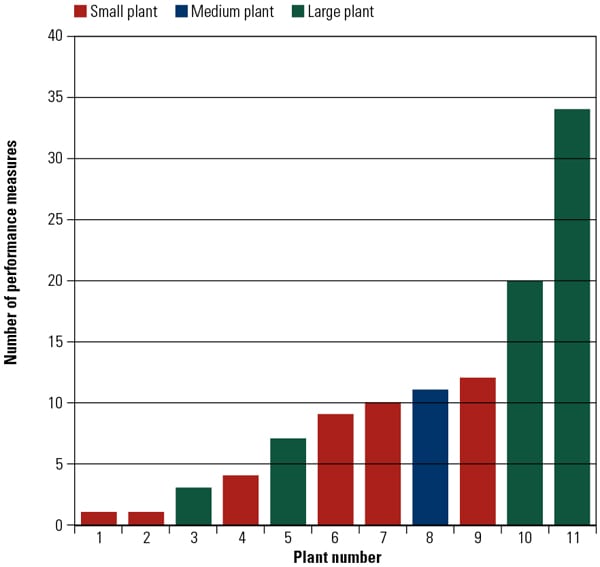 |
| 1. The number of station-level performance metrics used for compensation decisions. Source: EUCG |
Although the specific station-level metrics used varied widely, there were favorites. Table 1 shows metrics used by at least three utilities.
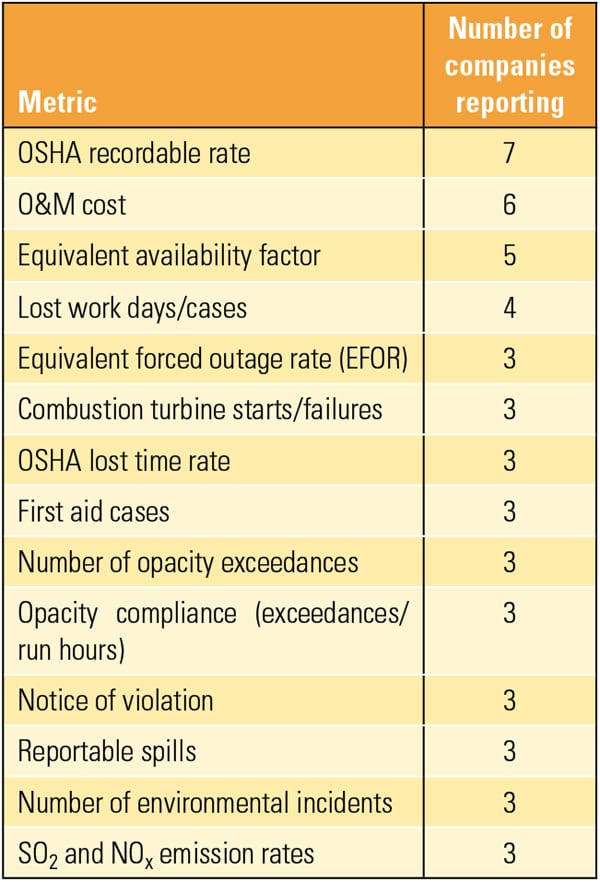 |
| Table 1. Popular station-level metrics used for compensation decisions. Source: EUCG |
At the fossil fleet or company level, only six of the 16 survey respondents used fleet-level metrics in compensation decisions (Figure 2). Of the fleets that did report using these metrics, an average of nine different ones were considered, close to the number used for station-level compensation decisions.
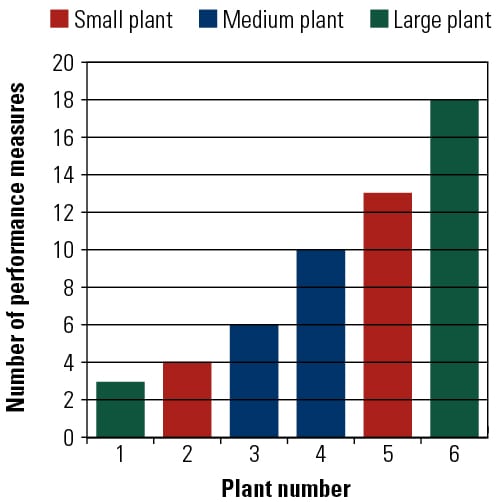 |
| 2. The number of fleet-level performance metrics used for compensation decisions. Source: EUCG |
Companies using these metrics were fairly evenly distributed among small, medium, and large fleet categories. Fleet-level metrics favored by at least three companies are listed in Table 2.
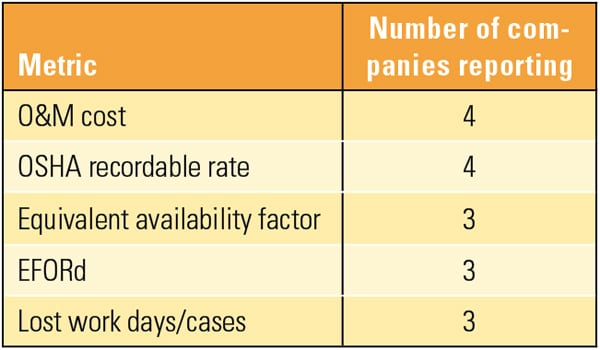 |
| Table 2. Popular fossil fleet–level metrics used for compensation decisions. Source: EUCG |
In Part I we examined favored station-level performance metrics. Figure 3 illustrates the number of station-level metrics used by each company and the portion of those metrics that are used for station-level compensation decisions. The survey found that an average of 43 station-level metrics were used and an average of nine were used for compensation decisions by the 11 companies using such metrics at all. (The maximum total station-level metrics was nearly 90; the minimum was nine.)
The obvious question when looking at Figure 3, is, Why are so many metrics tracked yet so few used for compensation purposes? For some companies, many of the metrics tracked are indicators of the same concerns. For example, start-up failures and boiler waterwall leaks both cause forced outages but are tracked and managed separately at the station level, whereas they may be combined as part of an overall forced outage metric at the fleet level. When it comes to picking the metric that best represents station-level employee performance, the more comprehensive metric often is chosen, such as equivalent availability factor or demand equivalent forced outage rate (EFORd) because these communicate a better overall sense of how the plant performed in a given year.
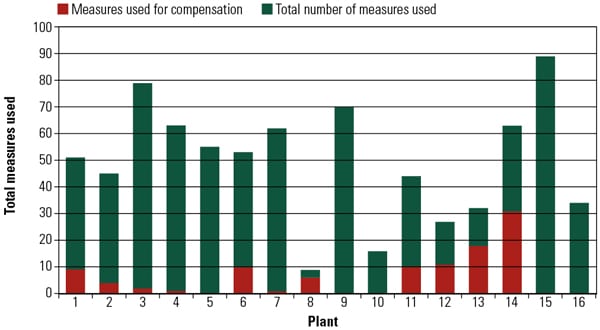 |
| 3. The number of station-level metrics tracked compared with the number of metrics used for compensation decisions. Source: EUCG |
Keeping Score
Scorecards (also called “balanced scorecards”) are a management tool used to ensure that business activities throughout an organization are well-aligned with corporate goals and objectives. The “balance,” to achieve a comprehensive view of the business, is achieved when as many nonfinancial activities relating to employees and customers are used as are financial and operational measures. Nonfinancial measures are useful because many purely financial measures speak to only past events.
Dr. Robert S. Kaplan, one of the originators of the balanced scorecard, suggests that “information age companies must… create future value through investment in customers, suppliers, employees, processes, technology, and innovation.” Kaplan’s approach is to use the scorecard as a tool to translate the typically more passive strategic plan goals into action-oriented activities by individual business units and down to individual workers to guide daily work. Kaplan also suggests that developing metrics, collecting data, and analyzing the data are necessary parts of the process.
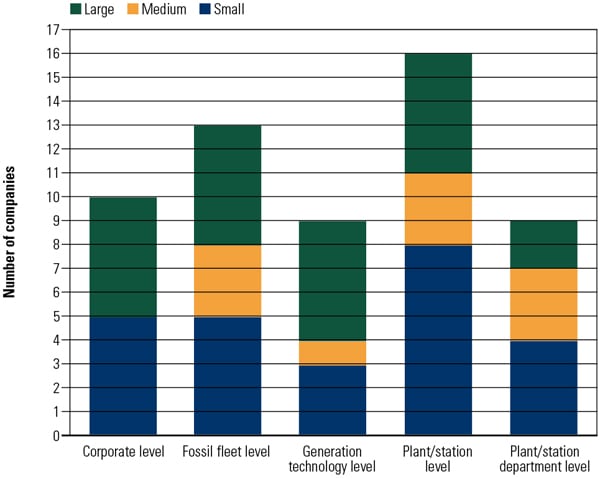
Surveyed companies were also asked, “At what level are scorecards tied to compensation?” Multiple answers were allowed (Figure 4). Each scorecard is a combination of unique metrics selected for company-specific reasons. For example, employees are usually assigned metrics based upon their position and function within the organization. Employees assigned to a specific station will typically be assigned some combination of station metrics, while a roving maintenance team that services multiple plants will usually be given fleet-level or fuel-type generation metrics. Company executives tend to have their performance measured using fleet-level metrics because multiple stations of different fuel types are under their control. Fleet metrics can also be used to focus employees at multiple stations on specific company-wide goals and objectives. Favoring fleet metrics for station employees is also an effective management tool to transform an “everyone for himself” attitude into a teamwork attitude.
 |
| 4. Scorecards are tied to compensation for many of the surveyed companies. Source: EUCG |
Some metrics are market driven. For example, in PJM the EFORd metric plays a large role in determining capacity payments received by each plant. Because this metric can influence actual payments or revenues, it may be weighted more heavily in a particular compensation program. Essentially, some metrics will have different weights depending on company circumstances.
Some metrics, like one of the several possible U.S. Occupational Safety and Health Administration (OSHA) metrics, can be applied to different employee groups and allow for roll-ups to the fleet level. For example, a plant may have an OSHA metric assigned that results in an OSHA target and score for that plant. At the fleet level, that same OSHA metric may be used, but possibly with a different fleet target and corresponding score.
As company strategic plans often change, so will the results of this survey should it be repeated. Certain key metrics will surely remain, but others will cease to be used, and new ones will find favor. For this moment in time, this glimpse into metrics used by power generation companies in their employee compensation programs should be helpful in designing your unique compensation program.
As explained in the first two reports, the survey data is presented in summary form in this article. The complete survey database contains much more data and links specific data to specific fleets, allowing the user to drill down to plant-level data and establish benchmarking peer groups. However, the EUCG is a “give to get” organization, meaning that if you want the entire benchmarking database, you will have to not only be a member of the EUCG but also add your survey results to the database.
— Charlene Foltzer (charlene.foltzer@pseg.com) is performance & metrics manager at PSEG Power in New Jersey and a member of the EUCG’s Fossil Productivity Committee.