One of the distinguishing characteristics of deregulated power markets is variable demand. The ability to operate efficiently at partial loads can determine whether a plant is profitable or not. This need creates special challenges for hydroelectric turbines, because at partial loads they often exhibit strong swirl in the draft tube at the outlet of the runner. As this swirling flow decelerates in the diffuser cone, it creates a hydrodynamic instability in the draft tube that looks like a rope twirling around a vortex.
This "vortex rope" causes two problems. The variable, high-pressure fluctuations in flow that it imposes on the walls of the draft tube reduce the efficiency of the turbine and foster fatigue damage that, over time, shortens turbine life. The phenomenon is most pronounced when the frequency of the vortex rope’s twirling matches the turbine’s mechanical resonance frequency.
In an operating turbine, it’s impossible to measure in real time either the position of the vortex rope or the frequency and amplitude of the pulsations it produces. Being able to accurately simulate the twirling under various operating conditions would be the next-best capability. The simulations would allow design engineers to predict the effect of different hydroturbine geometries on the size and characteristics of the vortex rope. Using this information, they then could design draft tubes with smaller pressure fluctuations, to the benefit of turbine efficiency and longevity.
Atlanta-based GE Energy has confirmed its ability to accurately simulate the position and pressure fluctuations of vortex ropes. Enormous computing power is needed to achieve the spatial and temporal resolution necessary to maintain accuracy. GE engineers overcame this challenge by using computational fluid dynamics (CFD) software with powerful parallel and pre- and post-processing capabilities.
"Our simulation predictions matched experimental measurements within 5% for the position of the vortex rope and 18% for its amplitude," said Thi Vu, a senior hydraulic engineer at GE Energy’s Hydropower Technology division in Montréal. "This is the first time that a simulation of the shape of a rotating vortex rope has been compared with empirical data. The excellent agreement between the two data sets will make it possible to improve the design of future hydropower turbines to minimize fatigue damage."
Crunching numbers, minimizing ropes
Manufacturers of a variety of plant systems through which steam, water, or gas flows increasingly use CFD tools to optimize the design of the equipment’s internal structures (see related article on p. 58). CFD analysis can provide approximate solutions to the coupled fluid-flow equations that govern mass, momentum, and energy transport. The technique’s flexibility makes it possible to solve these equations in very complex spaces—a big advantage over simpler modeling methods sometimes used for turbine design.
GE Energy engineers chose CFX software from ANSYS Inc. (Canonsburg, Pa.) as their modeling tool. Featuring an open architecture, the package also makes more-efficient use than competing products of the huge computing resources required for accurate simulations of the vortex rope. "Two characteristics of the rope create a need for huge processing power," explained Bernd Nennemann, a GE Energy research assistant. "The first is that the swirling movement of the rope often covers most of the draft tube. So a very fine CFD mesh is necessary to simulate the range and expanse of pressure fluctuations generated by rope movement. Second, the vortex rope is an unsteady phenomenon, so predicting its motion accurately requires solving flow equations repeatedly, in very small time steps."
Bench testing of flow, pressure
Physical testing played an important role in this project by providing measurements for correlating with the computer simulations.
Under the framework of the FLINDT (flow investigations in draft tube) project sponsored by Electricité de France and a number of major hydroturbine manufacturers, a team of researchers at École Polytechnique Fédérale de Lausanne (EPFL) in Switzerland worked with a scale model of a hydraulic turbine. The model simulates a turbine built in 1926 with an aluminum runner with a diameter of 4.1 meters. The unit’s original draft tube was designed using Kac-Moody geometry. For the purpose of the research project, a specially designed elbow draft tube with one pier replaced the original Moody draft tube.
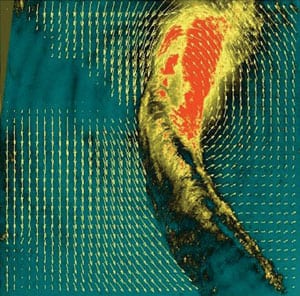
To measure the phenomena of interest in hydroturbines operating at low flow rates, G.D. Ciocan and M. Iliescu delivered—for the first time—experimental data on the velocity field in the zone where the vortex rope develops. The measurements (Figure 1) were performed using a 3D stereoscopic particle image velocimetry (PIV) imaging system from Dantec Dynamics Ltd. (Bristol, UK). The system uses two double-frame Hi-Sense cameras synchronized with a double-pulsed laser as well as a unit for processing the real-time velocity field data.
|
1. First measurements. These measurement techniques were used to develop empirical data for validating simulations of hydroturbines’ vortex ropes.
Courtesy: GE Energy and École Polytechnique Fédérale de Lausanne
|

The researchers designed a special transparent cone with two large symmetric windows to provide optical access to the cameras and a narrow window for access to the laser. All three windows were given flat external surfaces to minimize optical distortions. Data on the velocity field were obtained under several pressure conditions.
J. Arpe collected experimental pressure-fluctuation data by using a HP-VXI control system to simultaneously acquire signals from 96 pressure transducers mounted on the walls of the elbow draft tube (Figure 2). The signals were sampled at 200 Hz to provide a good dynamic range for the frequency analysis.
|
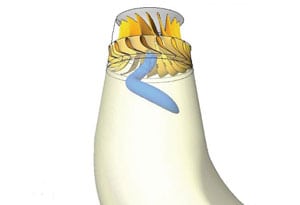
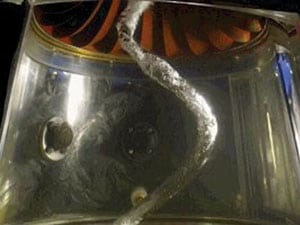
2. Rope dance. The flow structure of a vortex rope captured by particle image velocimetry.
Courtesy: GE Energy and École Polytechnique Fédérale de Lausanne
|
Simulation vs. reality
GE Energy engineers limited the domain of the simulation to the runner and draft tube as a tradeoff between accuracy and the size of computing resources needed (Figure 3). The directions of flow and mass flow were specified at the inlet boundary based on a previous, staged-flow analysis of the stay vane, guide vane, and runner assembly. An outlet boundary condition was specified for the outflow. After the engineers developed a steady-state solution for the flow domain, they used it to begin simulation of unsteady operation (Figure 4).
|
3. Model behavior. These were the computational flow domain and meshes developed for the simulation.
Courtesy: GE Energy and École Polytechnique Fédérale de Lausanne
|

|
4. Unsteady as she goes. Compare a simulation of unsteady vortex rope operation with an actual observation.
Courtesy: GE Energy and École Polytechnique Fédérale de Lausanne
|
Using a time step of one degree of revolution, it took about 1,000 time steps for fluctuations to begin and another 3,000 time steps to reach the periodic unsteady state. The numerical solution was well converged after 11,500 time steps, corresponding to 24 revolutions of the runner. Pressure and velocity were monitored at 1,200 different positions, and unsteady solutions were written every 10 time steps.
A comparison of the simulation’s predictions and physical measurements showed very good agreement. The numerically calculated static-pressure fluctuations matched up well against the experimental data. The simulation correctly predicted the amplitude of pressure fluctuations at the outlet of the runner, and the evolution of amplitude in the cone was in good agreement with experimental data for all sensors’ angular positions.
The difference between the experimental results and numerical predictions was less than 2.5% for mean pressure level—about the same as the accuracy of measurement. Simulations of the mean velocity field also showed good agreement with physical measurements. The phase average vector field showed only a small difference because it was closer to the cone wall in the simulation. The vorticity field (which shows the position of the vortex rope) also was well predicted by the simulation, with a small (5%) difference in the measured and predicted position of the vortex. However, the measured amplitude (intensity) of the vortex was about 18% smaller than the simulated predicted. This larger discrepancy was attributed to the use of a relatively coarse mesh to simulate the geometry of the draft tube, especially in its cone region.
"While vortex ropes have been simulated in the past, this is the first time that a simulation of a rotating rope has been compared to detailed experimental measurements under cavitation-free conditions," Vu said. "The accuracy of the predictions for the vortex’s position, rotational frequency, and intensity were very good. Quantitative analyses of the mean and phase-average velocity field, the vorticity field, and the vortex’s center position also showed good agreement. GE is looking forward to using simulations for designing new hydroturbines and for troubleshooting problems with existing turbines."