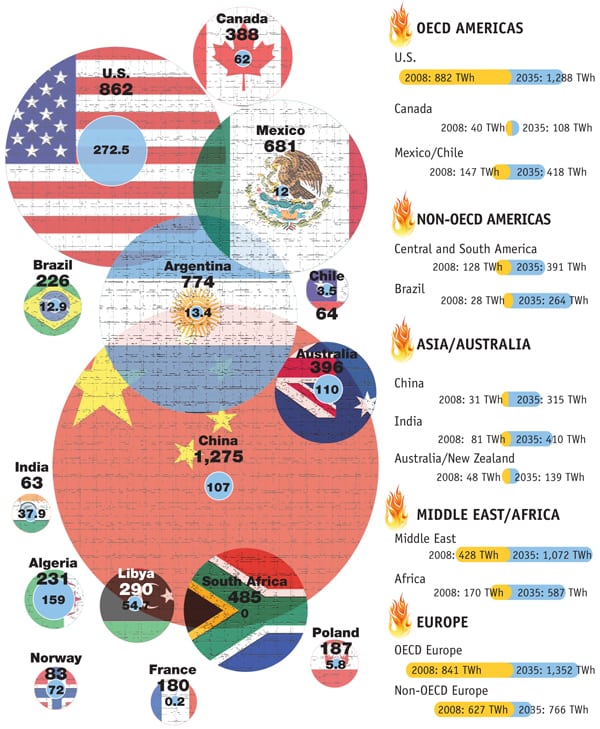
Large circles represent technical reserves and small (blue) circles represent potential reserves of shale gas, both in trillion cubic feet. Bars on the right represent each region’s existing natural gas–fired generation in 2008 (yellow) and the amount projected for 2035 (blue) in TWh. OECD = Organisation for Economic Co-operation and Development. Data source: Energy Information Administration/Advanced Resources International (ARI), 2011
—Sonal Patel is POWER’s senior writer